Exploratory data analysis in R
In this post we are going to use two packages designed to perform exploratory data analysis. This is usually the first thing to do with any data base or data frame, to get to know the data, its distribution and possible missing data. These two packages are skimr and dataxray.
Data
For this example, we are going to use flights dataset.
library(tidyverse)
library(skimr)
library(nycflights13)
# devtools::install_github("agstn/dataxray")
library(dataxray)

# Get flights data
data(flights)
skimr
Skimr is a package designed to skim over the data and get a basic description of the data. The information included in this disciption includes:
- Number of rows and columns.
- Number of variables by type (character, numeric, date).
- Number and percentage of missing values.
- Number of unique values (character) or mean, sd and quartiles (numeric).
- Histograms.
# General skim
flights |>
skim()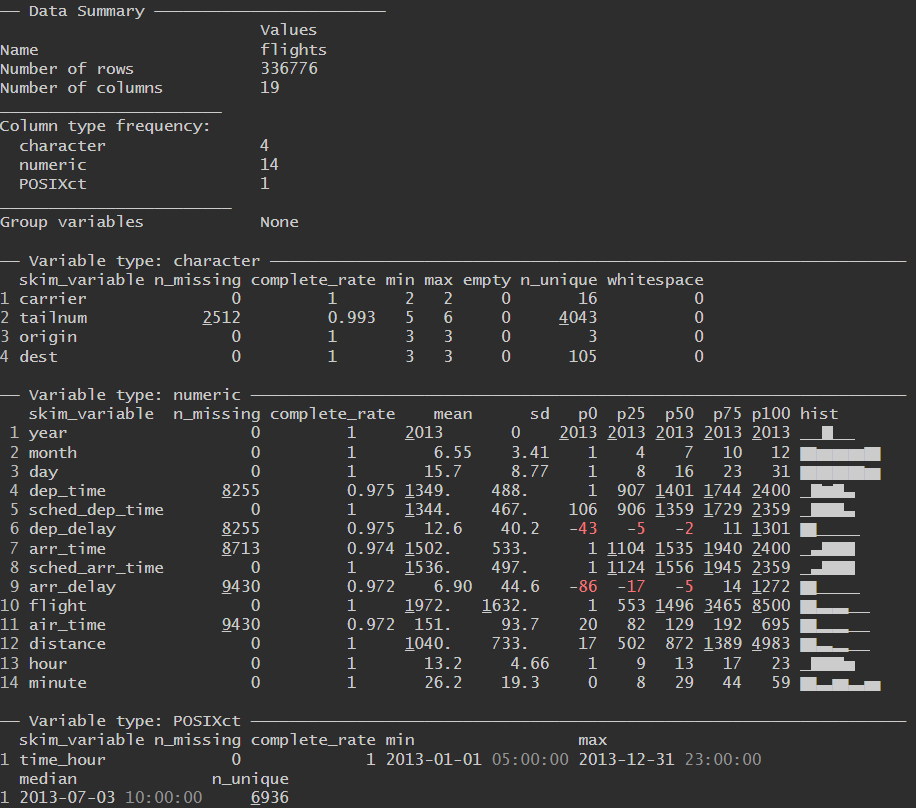 Example of skim results.
You can also use traditional dplyr syntax to select only particular variables or non missing rows.
# Select non na entries
flights |>
  skim() |>
  select(-n_missing)

# Skim particular variables
flights |>
  skim(air_time)
dataxray
Dataxray is a package that performs a similar exploratory data analysis to skimr, but its main advantage is that it has an interactive interface and has a fancier design. Nonetheless, it shows almost the same information as skimr; however it takes more time to show the results.
flights |>
  # Just to accelerate creation of xray
  slice(1:50000) |>
  make_xray() |>
  view_xray()
Example of dataxray interface.