Open Foris tools in R
In this post I will show you how to easily run two Open Foris tools in R to easily validate a map and obtain the area estimates corrected by the producer’s accuracies obtained in the confusion matrix. The repository of these tools can be found here: https://github.com/openforis/accuracy-assessment
There are several ways you can run the apps; however the easiest is to run the shiny app directly from the github repo.
Design
First, we will explore the design app.
library(shiny)
options(shiny.launch.browser = TRUE)
runGitHub("openforis/accuracy-assessment",subdir="aa_design")
Once you open R and run the previous code, you should see the following screen.
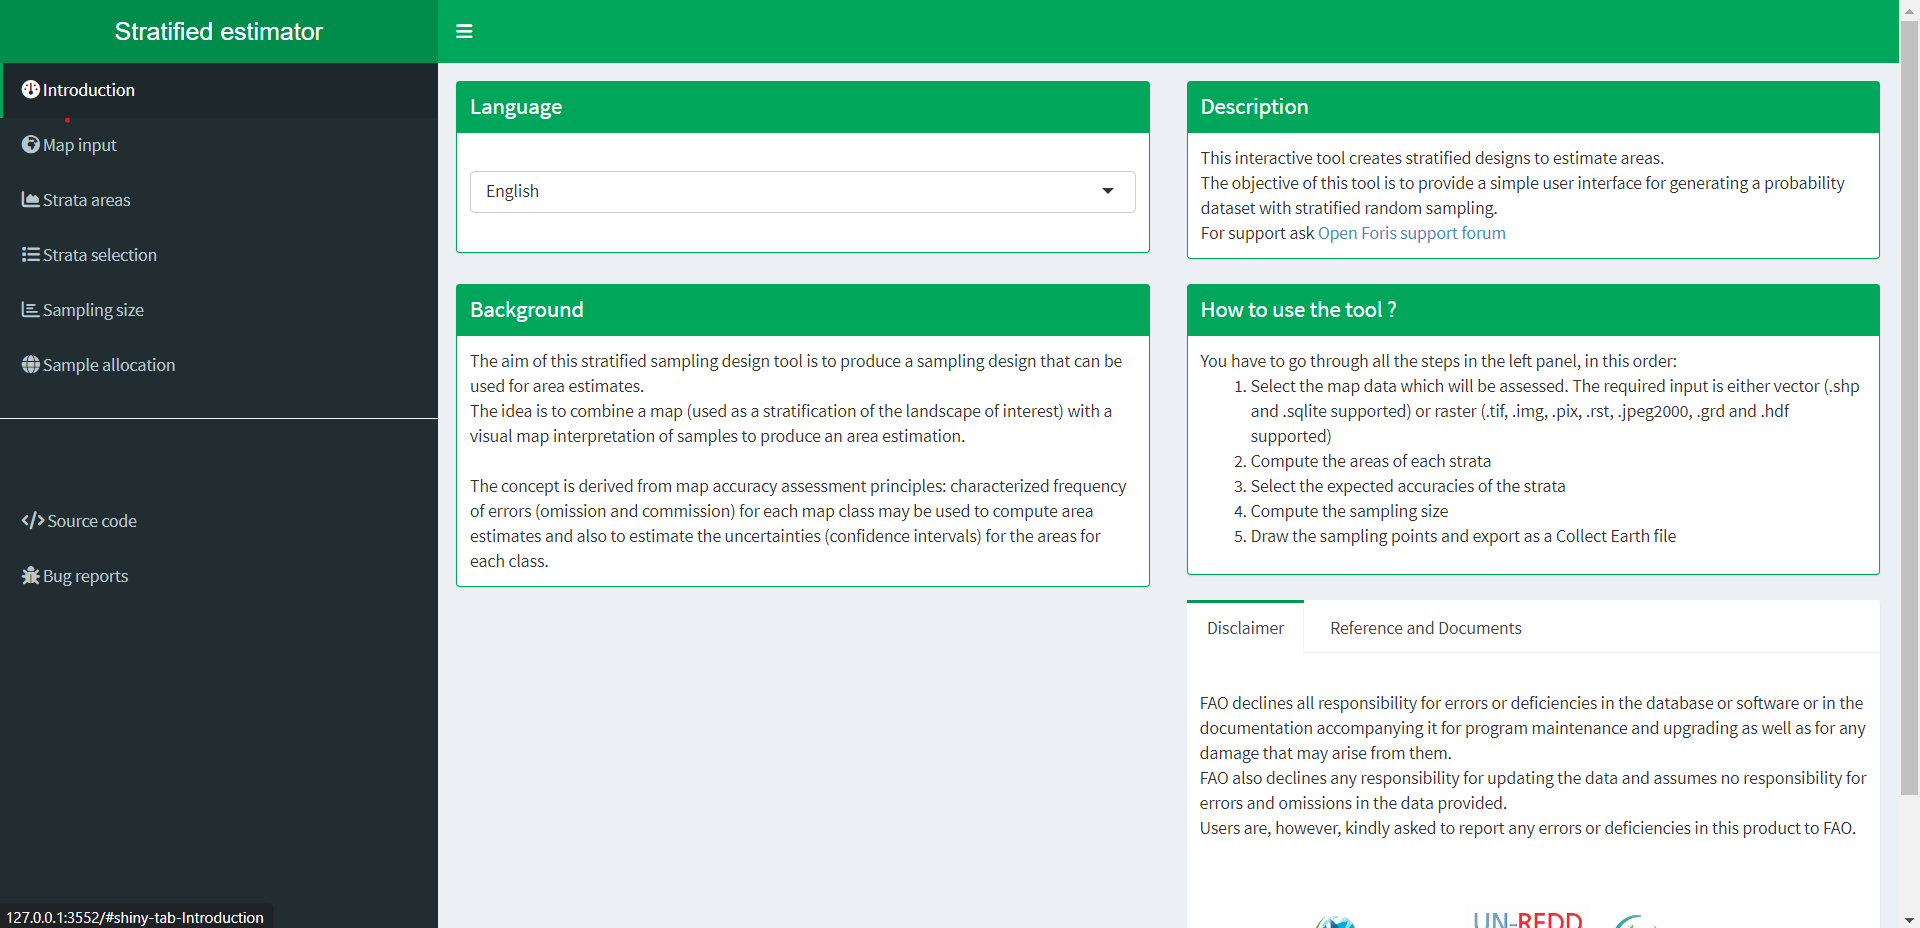 Open Foris design app
Map input
In this app, you will see in the left panel several submenus. The first one is the Map input, where you can load your classification. Once your image is loaded, go to the next submenu, Strata areas.
Strata areas
In this menu, the first option will read: area calculation and legend generation. Click here and wait several seconds until the menu that is under this one (Legend labeling) appears with the values of the raster. Here you can change the raster values for a description of that class. For example, Class name 1 could be water, class name 2, forest, etc. Once the descriptions have been added, click on submit legend. Once the legend is submitted the panel on the upper right side should appear with the names of the classes and its area in a table. You can download that table as a csv. Then go to the next submenu: Strata selection.
Strata selection
Here you set the expected user’s accuracy for each class. Commonly the high value is set for common classes and the low value for rare classes. Once you select the high and low expected user’s accuracy in the sliders, in the lower right panel select the confidence values for each class. Click on the empty spaces and select each class in its corresponding high or low value.
Sampling size
The next step is selecting the sample size to obtain a desired standard error of the overall accuracy of the map. Here you can select the target standard error (default value = 0.01) and the minimum sample size per strata (default value = 100). A smaller standard error will imply a higher number of points, while the minimum sample size is sometimes recommended of being around 50. If the panel on the right does not adjust its estimates once you change the values in the first panel, verify that the modify the sampling size button is turned off.
Sample allocation
Finally, you just need to generate the sampling points by clicking in the button of the final menu. Here a vector file will be generated with the areas to be verified to get the accuracy of the map. Here you can set the size of the intepretation box (min 30 m). Once the points are generated (after several seconds) a map will appear showing the generated points and a new submenu will appear to download the points in the format you desire.
Analysis
The second app can be run by using the following code:
library(shiny)
options(shiny.launch.browser = TRUE)
runGitHub("openforis/accuracy-assessment",subdir="aa_analysis")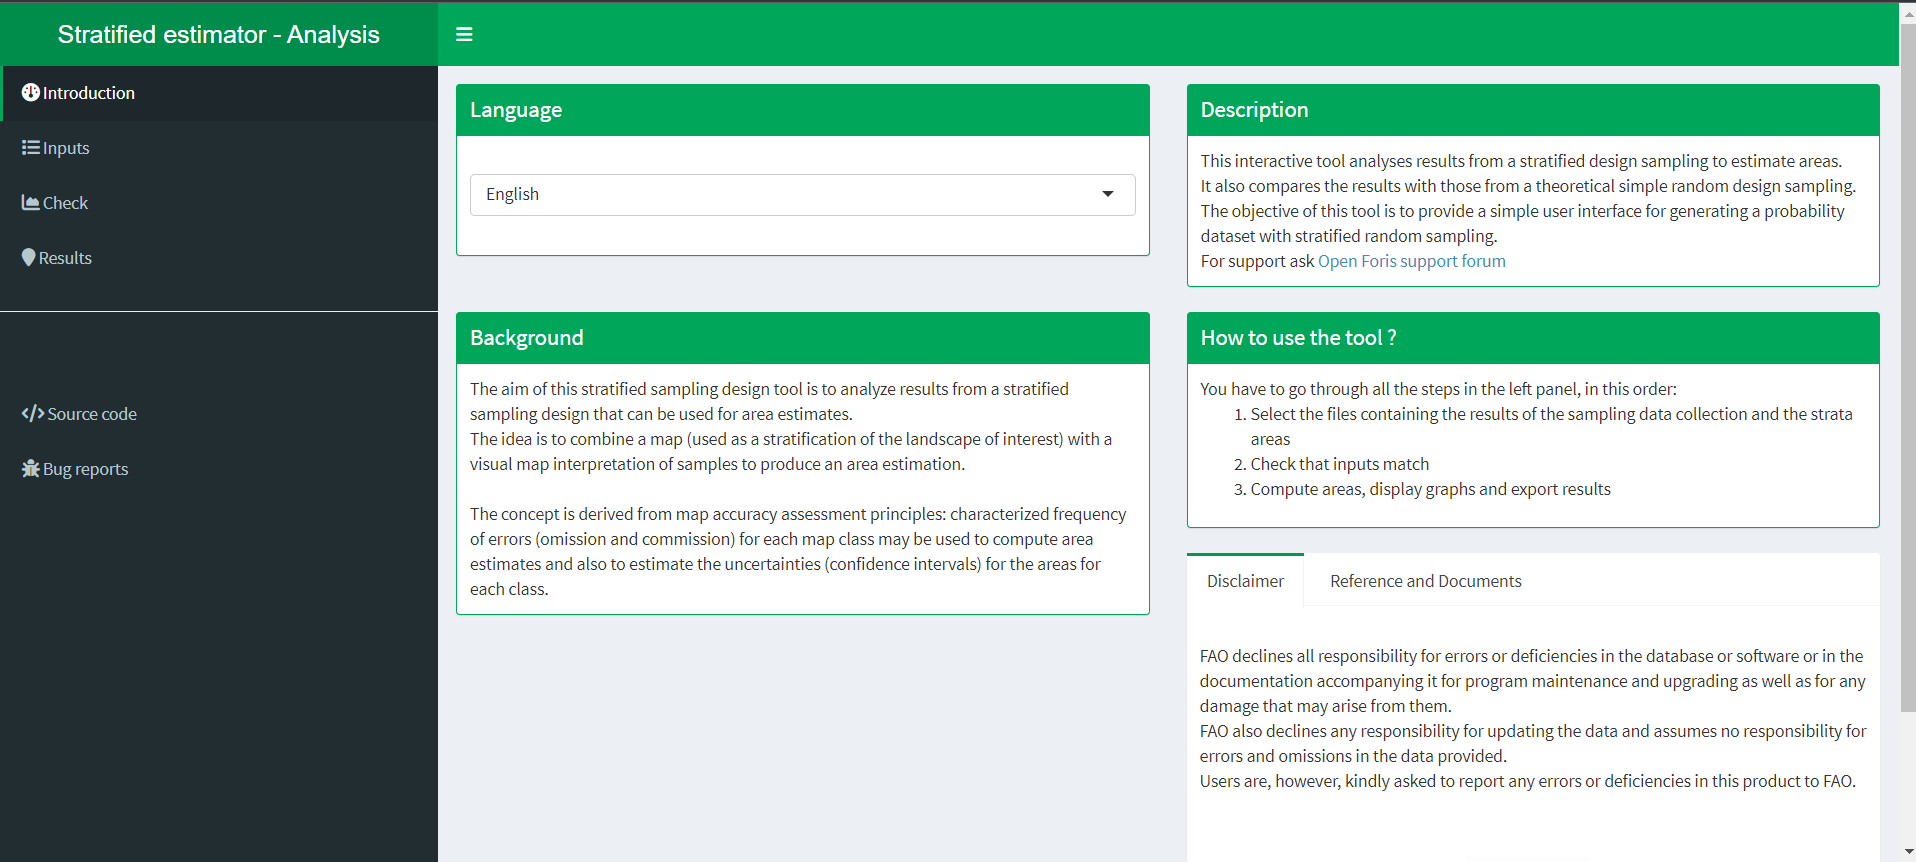 Open Foris analysis app
Once you see this window in your web browser, you can click on the first submenu: Inputs.
Inputs
Here you should add the csv file that contains the data for each validation points generated in the previous app. However this file has been verified an thus, it should contain one column indicating the reference data (by ground truth or visual interpretation) and the original map data (the classification). Afterward, you should add a csv file containing the area data by class (generated in the previous app).
Once you add the two files, a new panel will appear on the right side. Here you should indicate which column has the reference data (by ground truth or visual interpretation) and which one the map class. Also, indicate the columns in the area file indicating the area and the class.
Check
Here you can check the spatial distribution of your verification data. Here you just need to indicate the columns containing the x and y coordinates data.
Results
Here you can see the confusion matrix from your data. Also, in the lower part you can set the desired confidence interval for the area estimates (by default 95 %). Finally. the corrected area estimates should appear in the right panel. In the last test I made with this app, this last part had a bug; thus, I suggest cloning the repo and running it locally as a shiny app. In this last approach, you need to open the app_analysis_bckup_20161024 file inside the Rscript folder and run eveything from start to end. Finally, this way the app should work without any error showing that the names in the two files (1) reference and map classes and 2) areas) do not match.