Shiny App with spatial data
This post will show you how to build a shiny app to visualize spatial data (mainly in raster and vector format). Remember that you can also build other types of shiny apps, but I decided to focus this post on spatial data.
So the first thing is going to open RStudio, click on New Project -> New Project -> Shiny application and create new shiny app folder.
The first thing is to load the necessary packages
library(shiny)
library(raster)
library(leaflet)
library(dplyr)
library(sf)
library(RColorBrewer)
Then you are going to load the raster and vector data. Additionally, you need to create a palette to show the DEM we loaded and set customized icons to show the vector data. Finally, you will create the legend entries for each of the customized icons.
# Load the raster and vector data
sitios <- st_read("Data/SitiosPtsAll.gpkg") |>
  st_transform(4326)
barrancas <- st_read("Data/BarrancasAll.gpkg") |>
  st_transform(4326)
DEM <- raster("Data/DEM.tif")

# Palette to show DEM
mypal <- palette(gray(seq(0,1,length.out = 10)))

myIcons <- icons(
  iconUrl = case_when(sitios$Geositio == "Localidad" ~ "www/house.png",
                      sitios$Geositio == "Templo" ~ "www/iglesia.png",
                      sitios$Geositio == "Arbol" ~ "www/tree.png",
                      sitios$Geositio == "Cerro" ~ "www/peak.png",
                      sitios$Geositio == "Paraje" ~ "www/walker.png",
                      sitios$Geositio == "Ranchería" ~ "www/hostel.png",
                      sitios$Geositio == "Crucero" ~ "www/crossroad.png",
                      TRUE ~ "www/circle.png"),
  iconWidth = 15,
  iconHeight = 15,
  iconAnchorX = 7,
  iconAnchorY = 7,
  className = "Sitios"
)

html_legend <- '<img src="house.png" height="15" width="15">Localidad<br>
                <img src="iglesia.png" height="15" width="15">Templo<br>
                <img src="tree.png" height="15" width="15">Árbol<br>
                <img src="peak.png" height="15" width="15">Cerro<br>
                <img src="walker.png" height="15" width="15">Paraje<br>
                <img src="hostel.png" height="15" width="15">Ranchería<br>
                <img src="crossroad.png" height="15" width="15">Crucero<br>
                <img src="circle.png" height="15" width="15">Otro<br>'
Then, you need to set up the users interface. In this case, since we are interested in navigating spatial data, we are using a vertical layout.
# Define the UI for the app
ui <- fluidPage(
  titlePanel("Cuilala App"),
  verticalLayout(
    titlePanel("Cuilala información espacial"),
  )
)
Then create below that same script the server side script. Most of this part is setting up the leaflet visualization, adding a basemap (ESRI world imagery), adding the markers (point data), DEM (raster data) and other features (lines data), adding control layers buttons, as well as the legend for our customized icons and a scale bar. Finally, you need to create an observe event to watch for clicks over the markers, to show up their details when clicked.
# Define the server for the app
server <- function(input, output) {
  # Render the map
  output$map <- renderLeaflet({
    # Create the leaflet map
    leaflet(data = sitios) %>%
      addProviderTiles('Esri.WorldImagery') %>%
      # Add markers for vector data
      addMarkers(data = sitios,
                 popup = ~Nombre,
                 group = "Sitios",
                 icon = myIcons,
               ) %>%
      # Add the raster layer
      addRasterImage(x = DEM,
                     colors = mypal,
                     method = "ngb",
                     group = "MDE",
                     opacity = 70) %>%
      # Add polylines layer
      addPolylines(data = barrancas,
        color = "royalblue",
        group = "Barrancas",
        popup = ~Nombre
      ) %>%
      # Add Layers control (turn on and off)
      addLayersControl(
        baseGroups = c("ESRI Imagery"),
        overlayGroups = c("Sitios", "Barrancas", "MDE"),
        options = layersControlOptions(collapsed = FALSE)
      ) %>%
      # Add legend for custom icons
      addControl(
        html = html_legend,
        position = "bottomleft"
      ) %>%
      # Add scale bar
      addScaleBar(position = "bottomright",
                  options = scaleBarOptions(
                    maxWidth = 100,
                    metric = TRUE,
                    imperial = FALSE,
                    updateWhenIdle = TRUE
                  ))
  })

  # Observe event for clicking over a marker and showing details
  observeEvent(input$mapmarker_click, {
    p <- input$map_marker_click
    print(p)
  })
}
Finally, run the app.
# Run the app
shinyApp(ui, server)
A snapshot of the result:
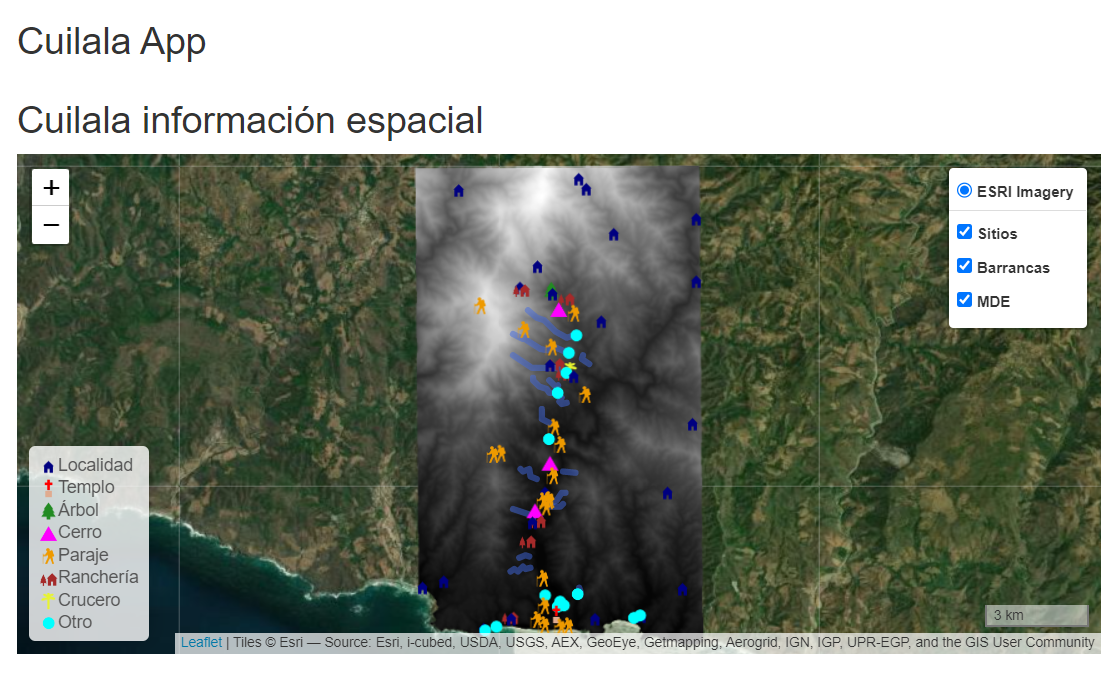 Shiny app to visualize and explore spatial data.
The real results hosted in shinyapps.io: https://jonathanvsv.shinyapps.io/cuilalaapp/