Here are some photos, maps or figures I have made:
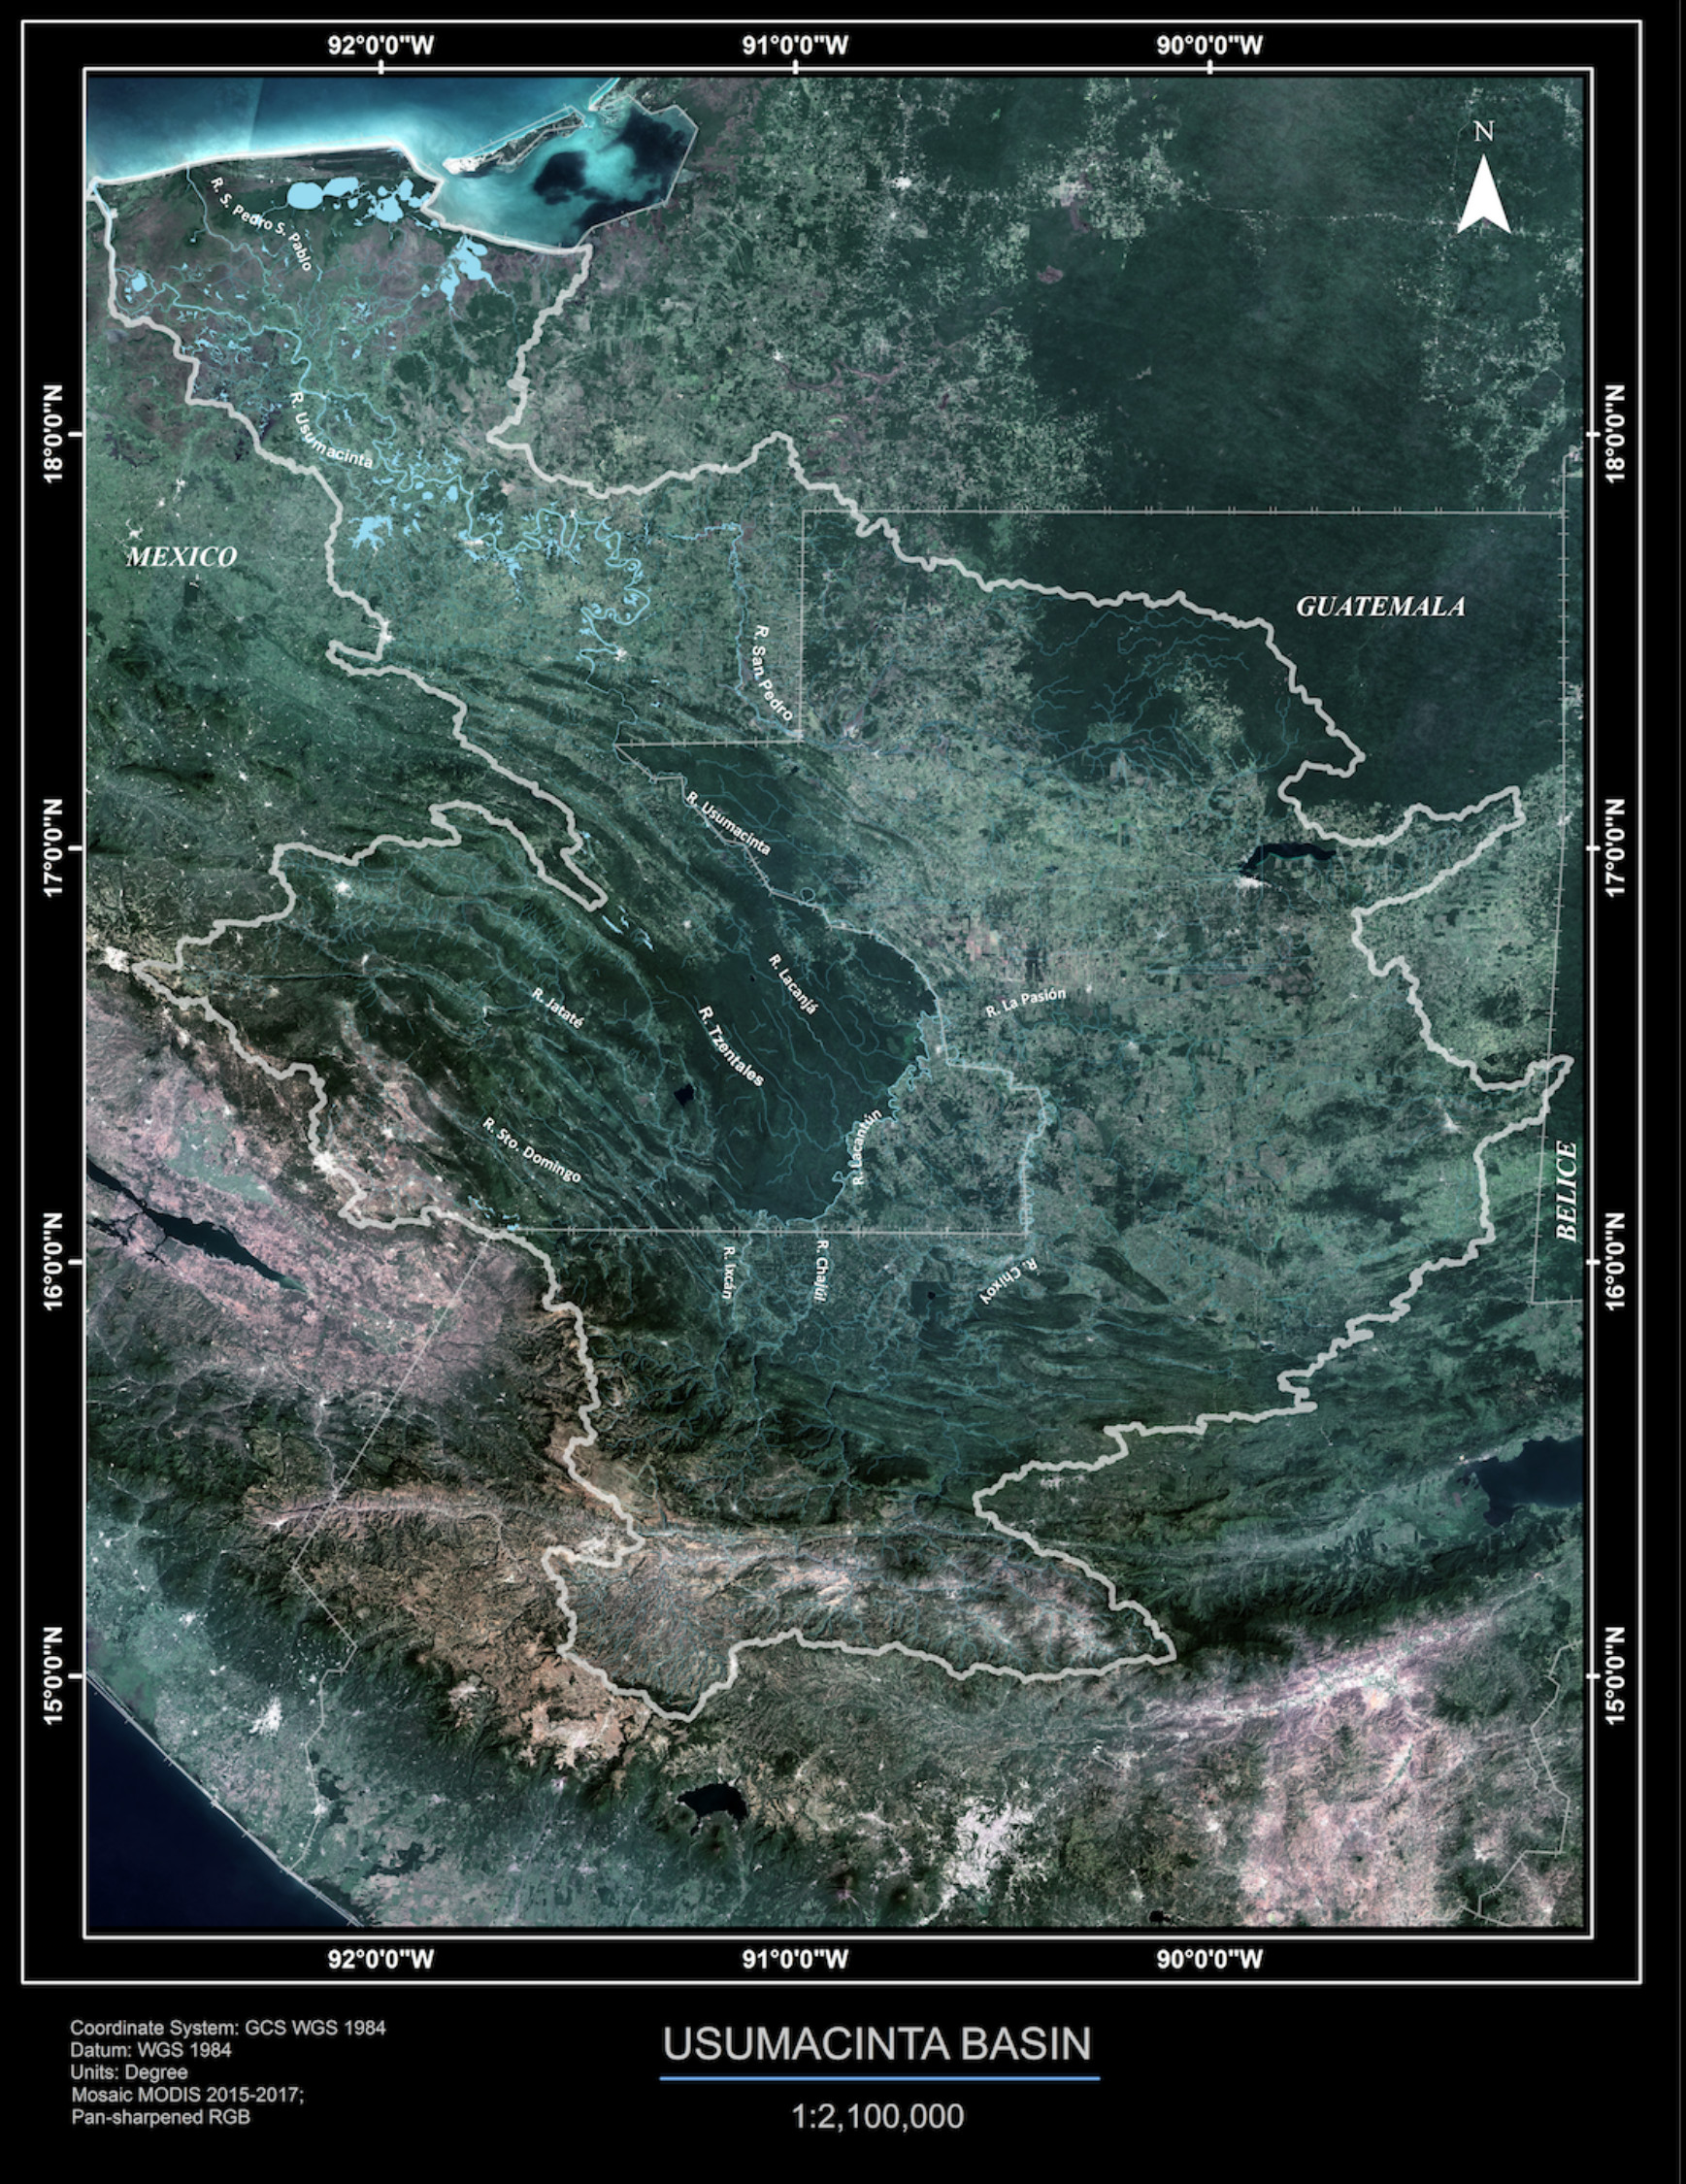
Cloudless MODIS composite (2015 - 2017) of the Usumacinta basin and surrounding areas. Figure was made in collaboration with C. Peralta-Carreta and can be seen in the Museo de Historia Natural, CDMX, Mexico
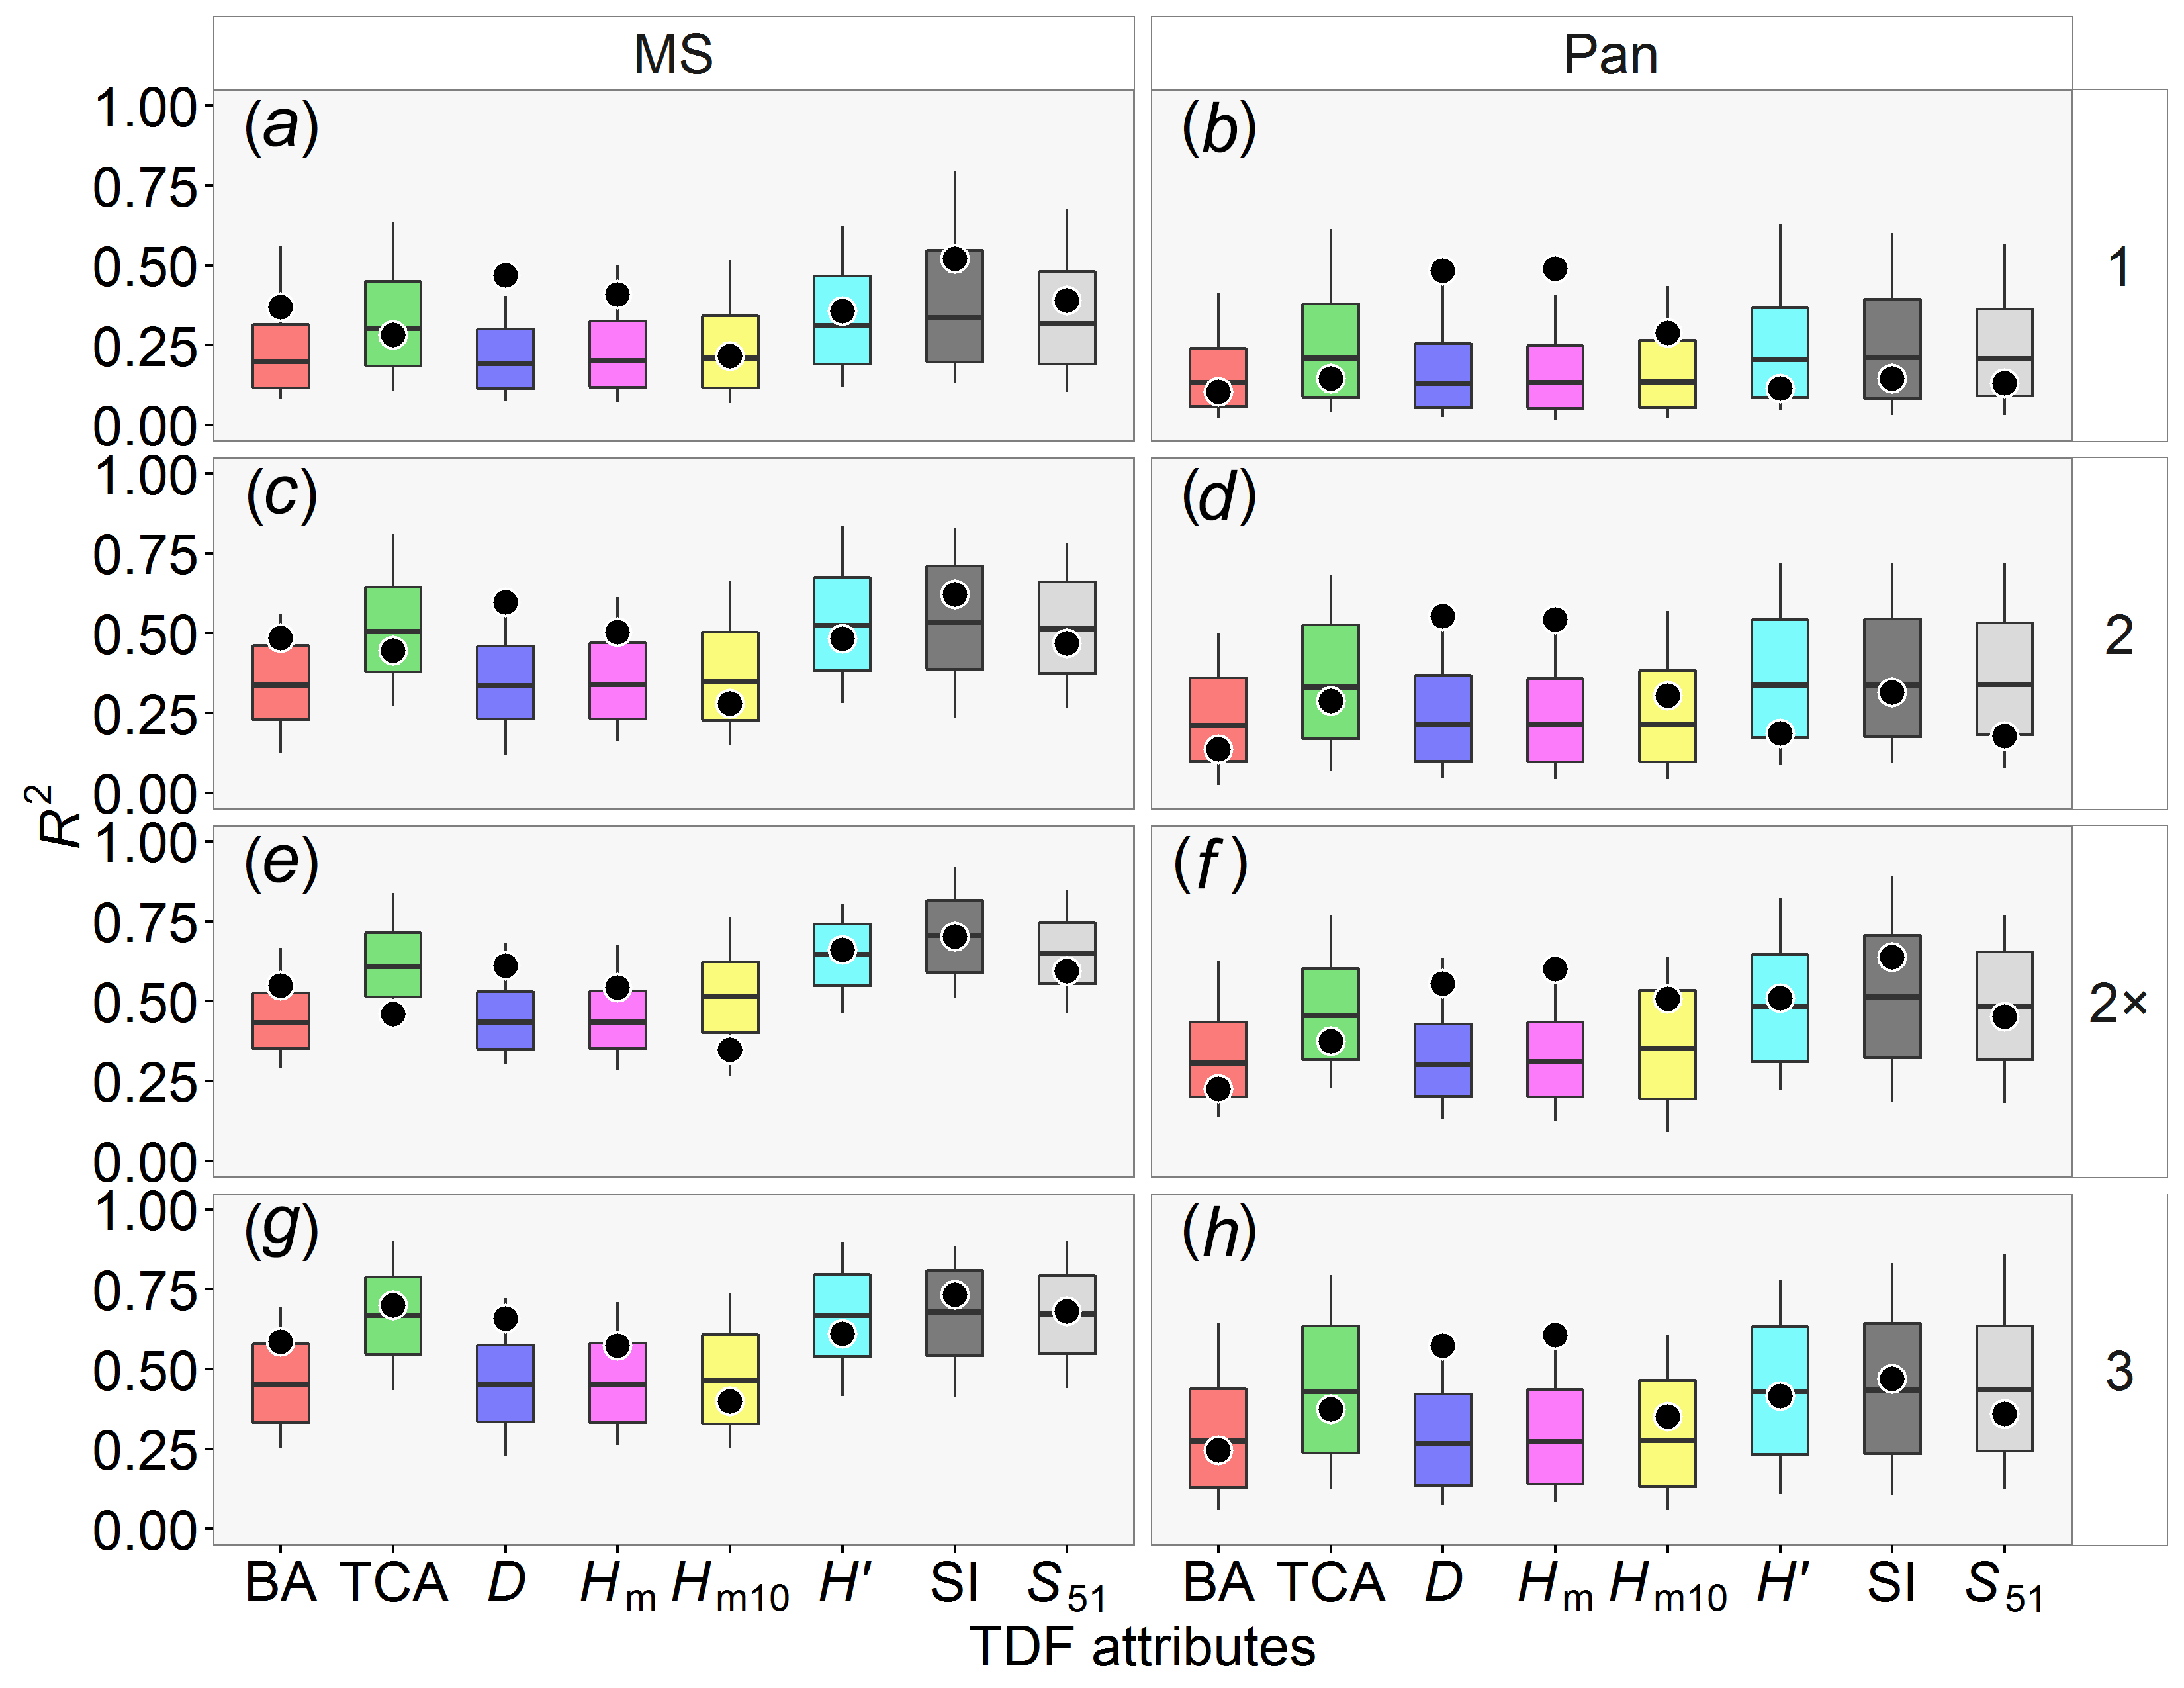
Goodness-of-fit of the best models (black points) and its corresponding maximum goodness-of-fit distribution expected at random (boxes) for each tropical dry forest attribute (structural and diversity). Models were constructed using GLCM texture metrics calculated from multispectral bands (MS) and panchromatic (Pan) as explanatory variables. Figure from Solórzano et al. (2017).
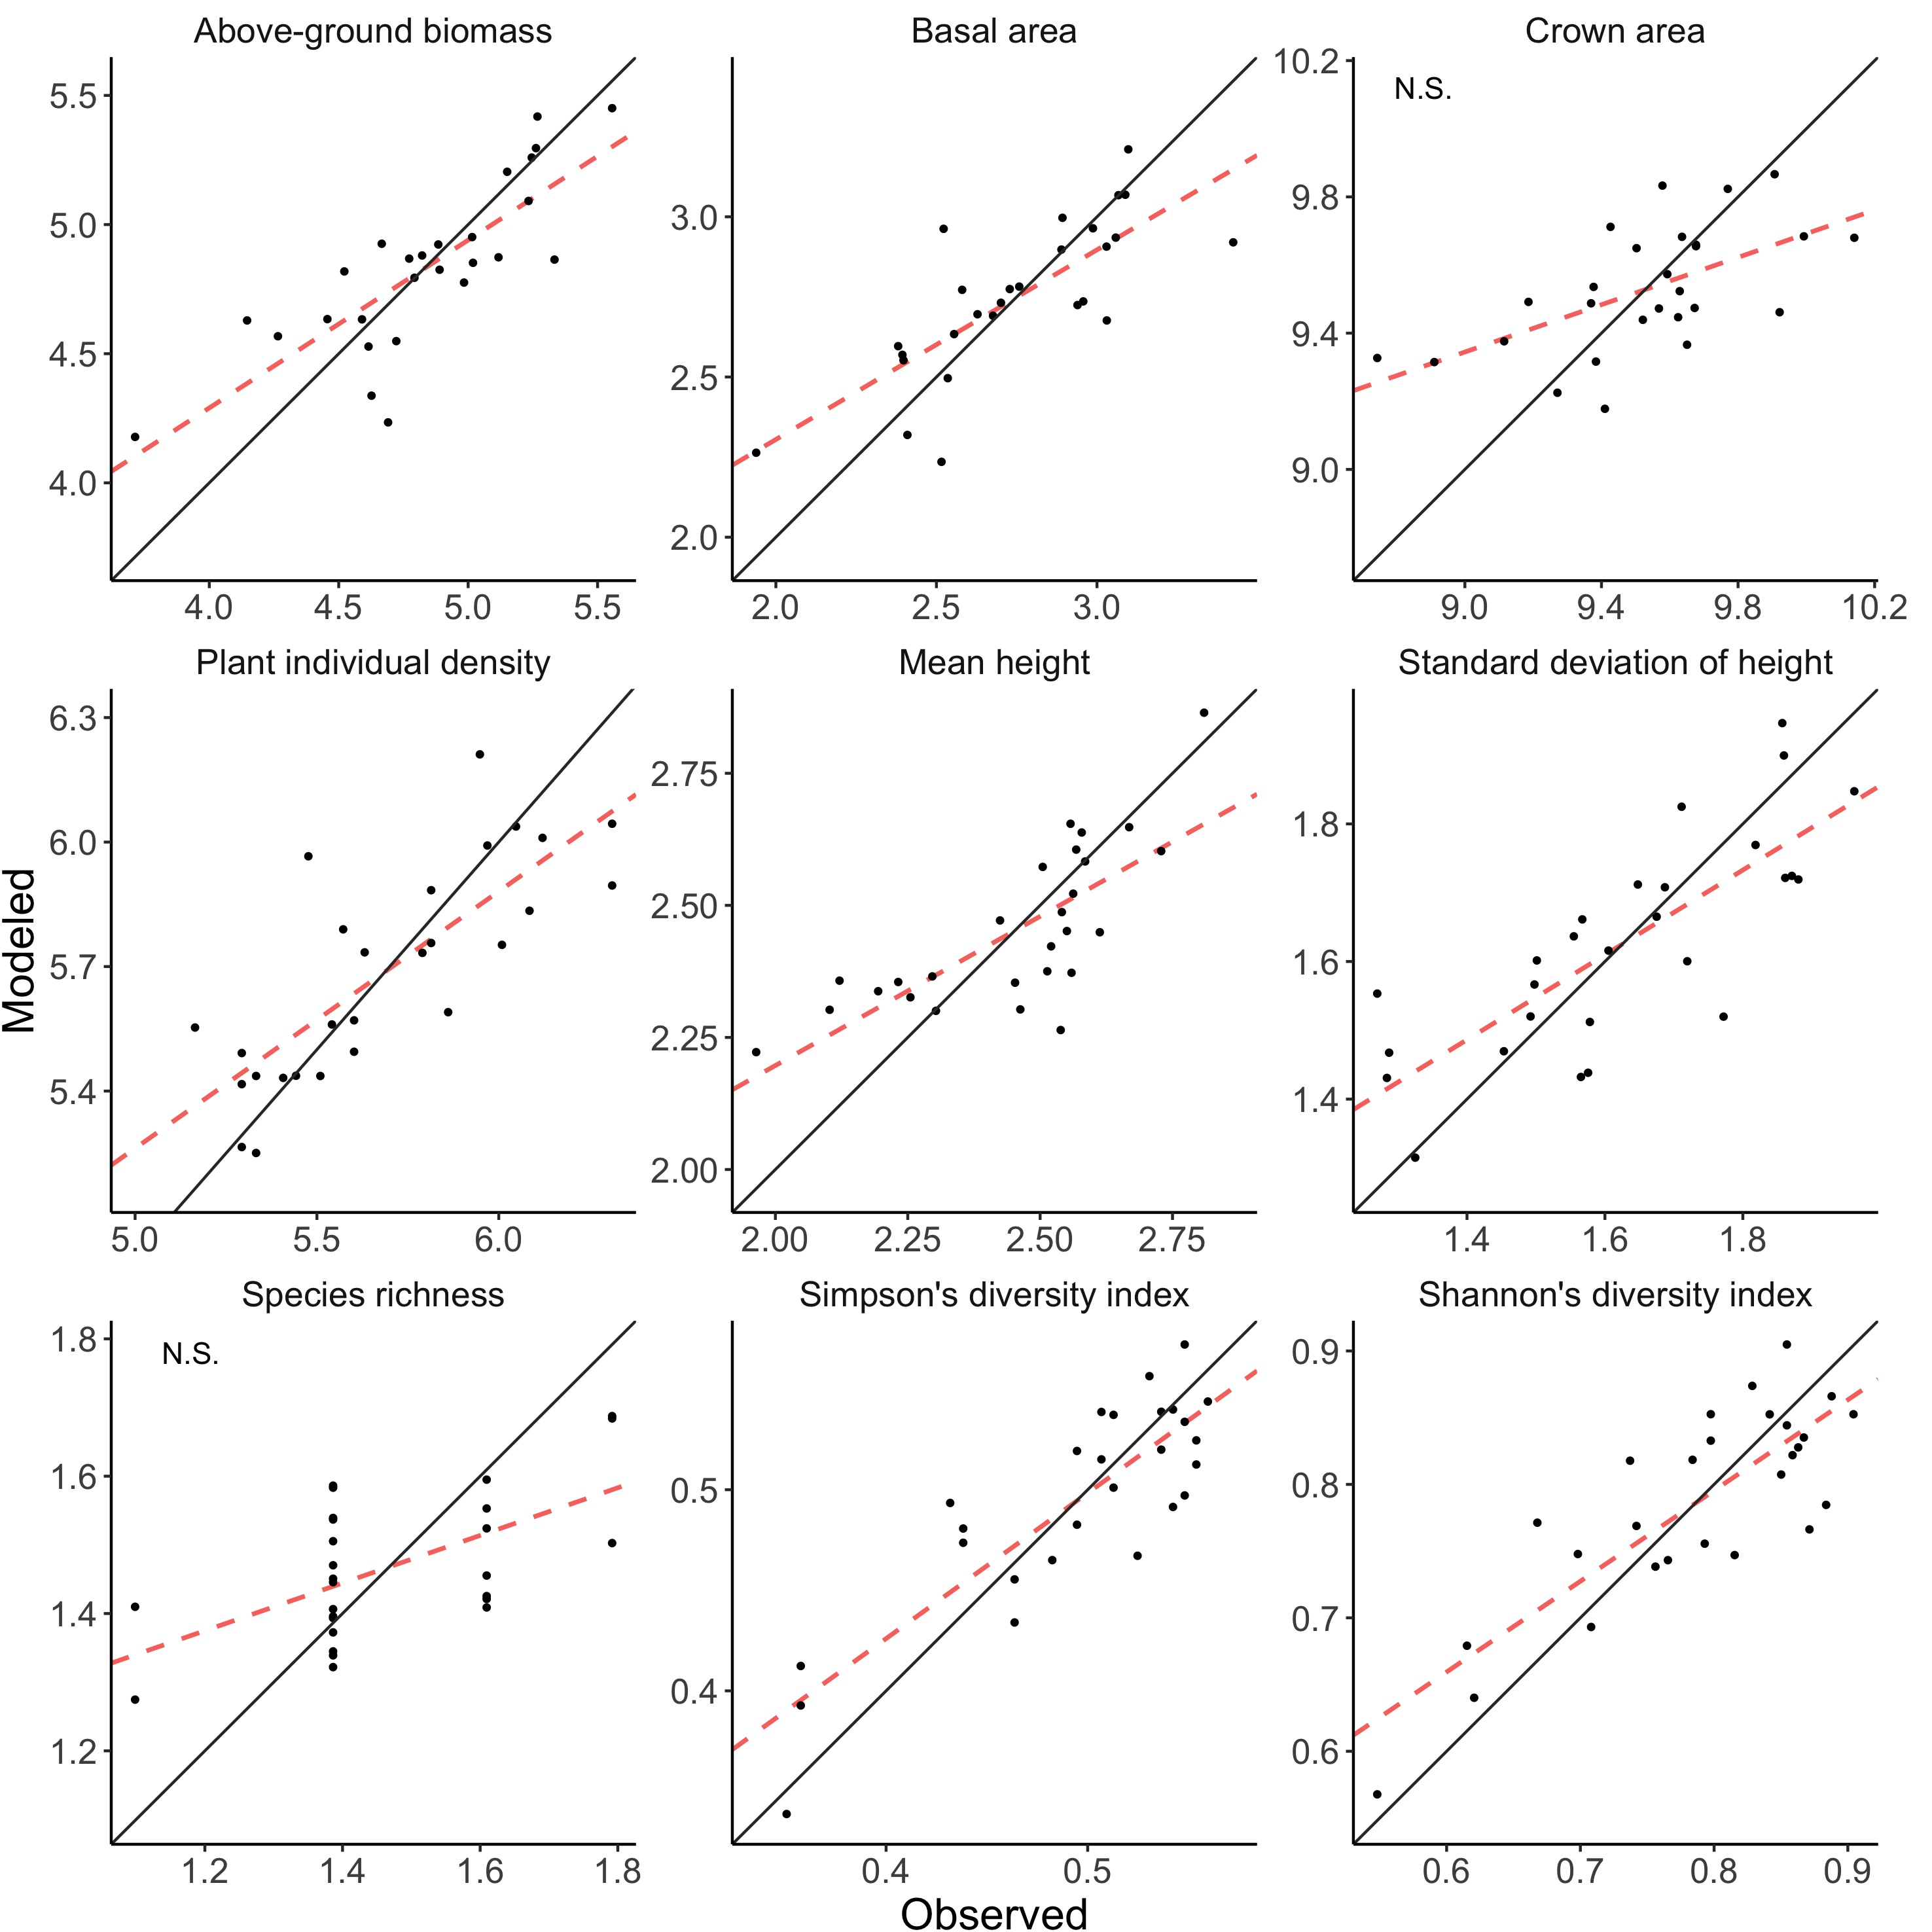
Observed versus modeled values and its corresponding linear fit (dashed line) of the best model for each vegetation attribute (ln-transformed) of a Tropical Swamp Forest. Models were fitted using image GLCM texture metric as explanatory variables. Figure from Solórzano et al. (2018).
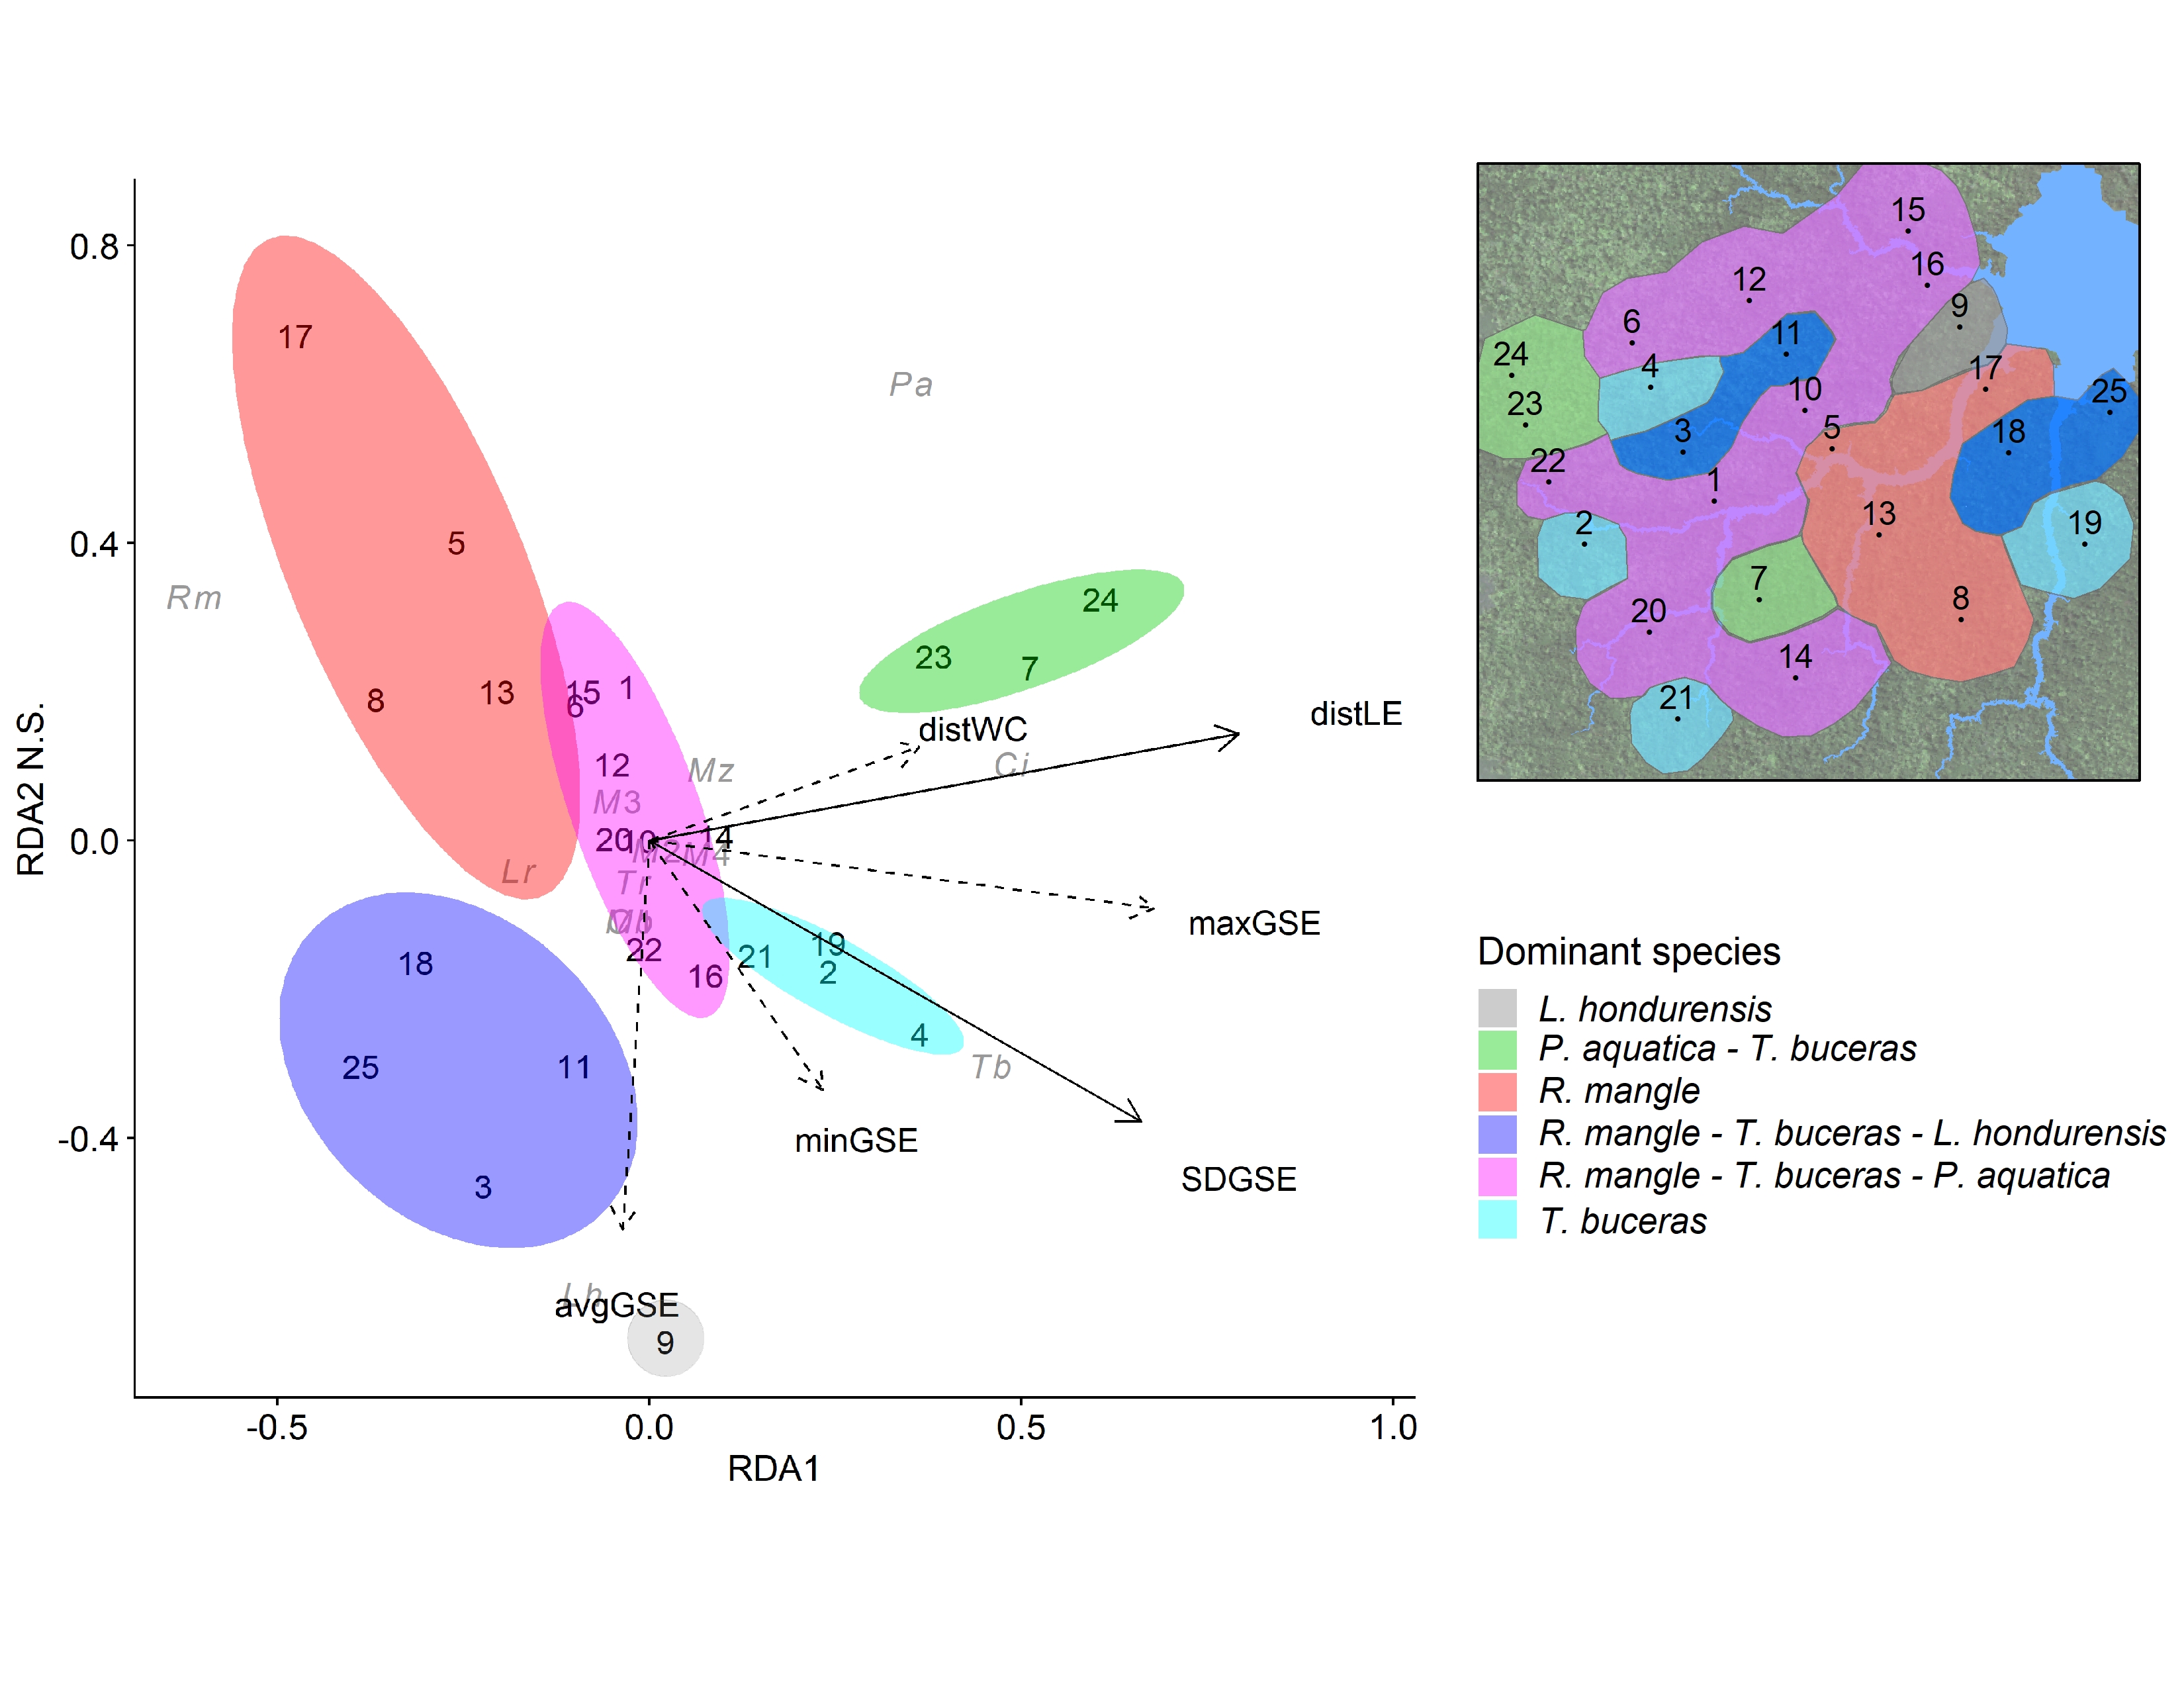
RDA ordination showing the scores of the species abundance (gray letters), plots (black numbers) and environmental proxies (black letters) according to the RDA first two principal axes; although, the second axis was not significant. Environmental proxies included distance to water bodies and microtopography variables. Figure from Solórzano et al. (2020).
Tree cover area lost between 2000 and 2016 according to the Global Forest Change data in the Usumacinta River basin. Data are grouped by land cover / land use (Serie II, INEGI 2001) and part of the basin (low, mid, high). Figure from Peralta-Carreta et al. (2019).
Number of available Landsat (4-8) images by path (upper border) and row (right border) of Mexico’s surface between 1972 - 2017. Additionally, the percentage of images by cloud cover percentage is shown by the bar color. Figure from Solórzano et al. (2020).
Plots location where conserved and degraded tropical dry forest was sampled in the Ayuquila River basin. Figure from Gao et al. (2020).
Land use land cover map obtained using Sentinel-1 and Sentinel-2 imagery and a U-net architecture. Figure from Solórzano et al. (2021).
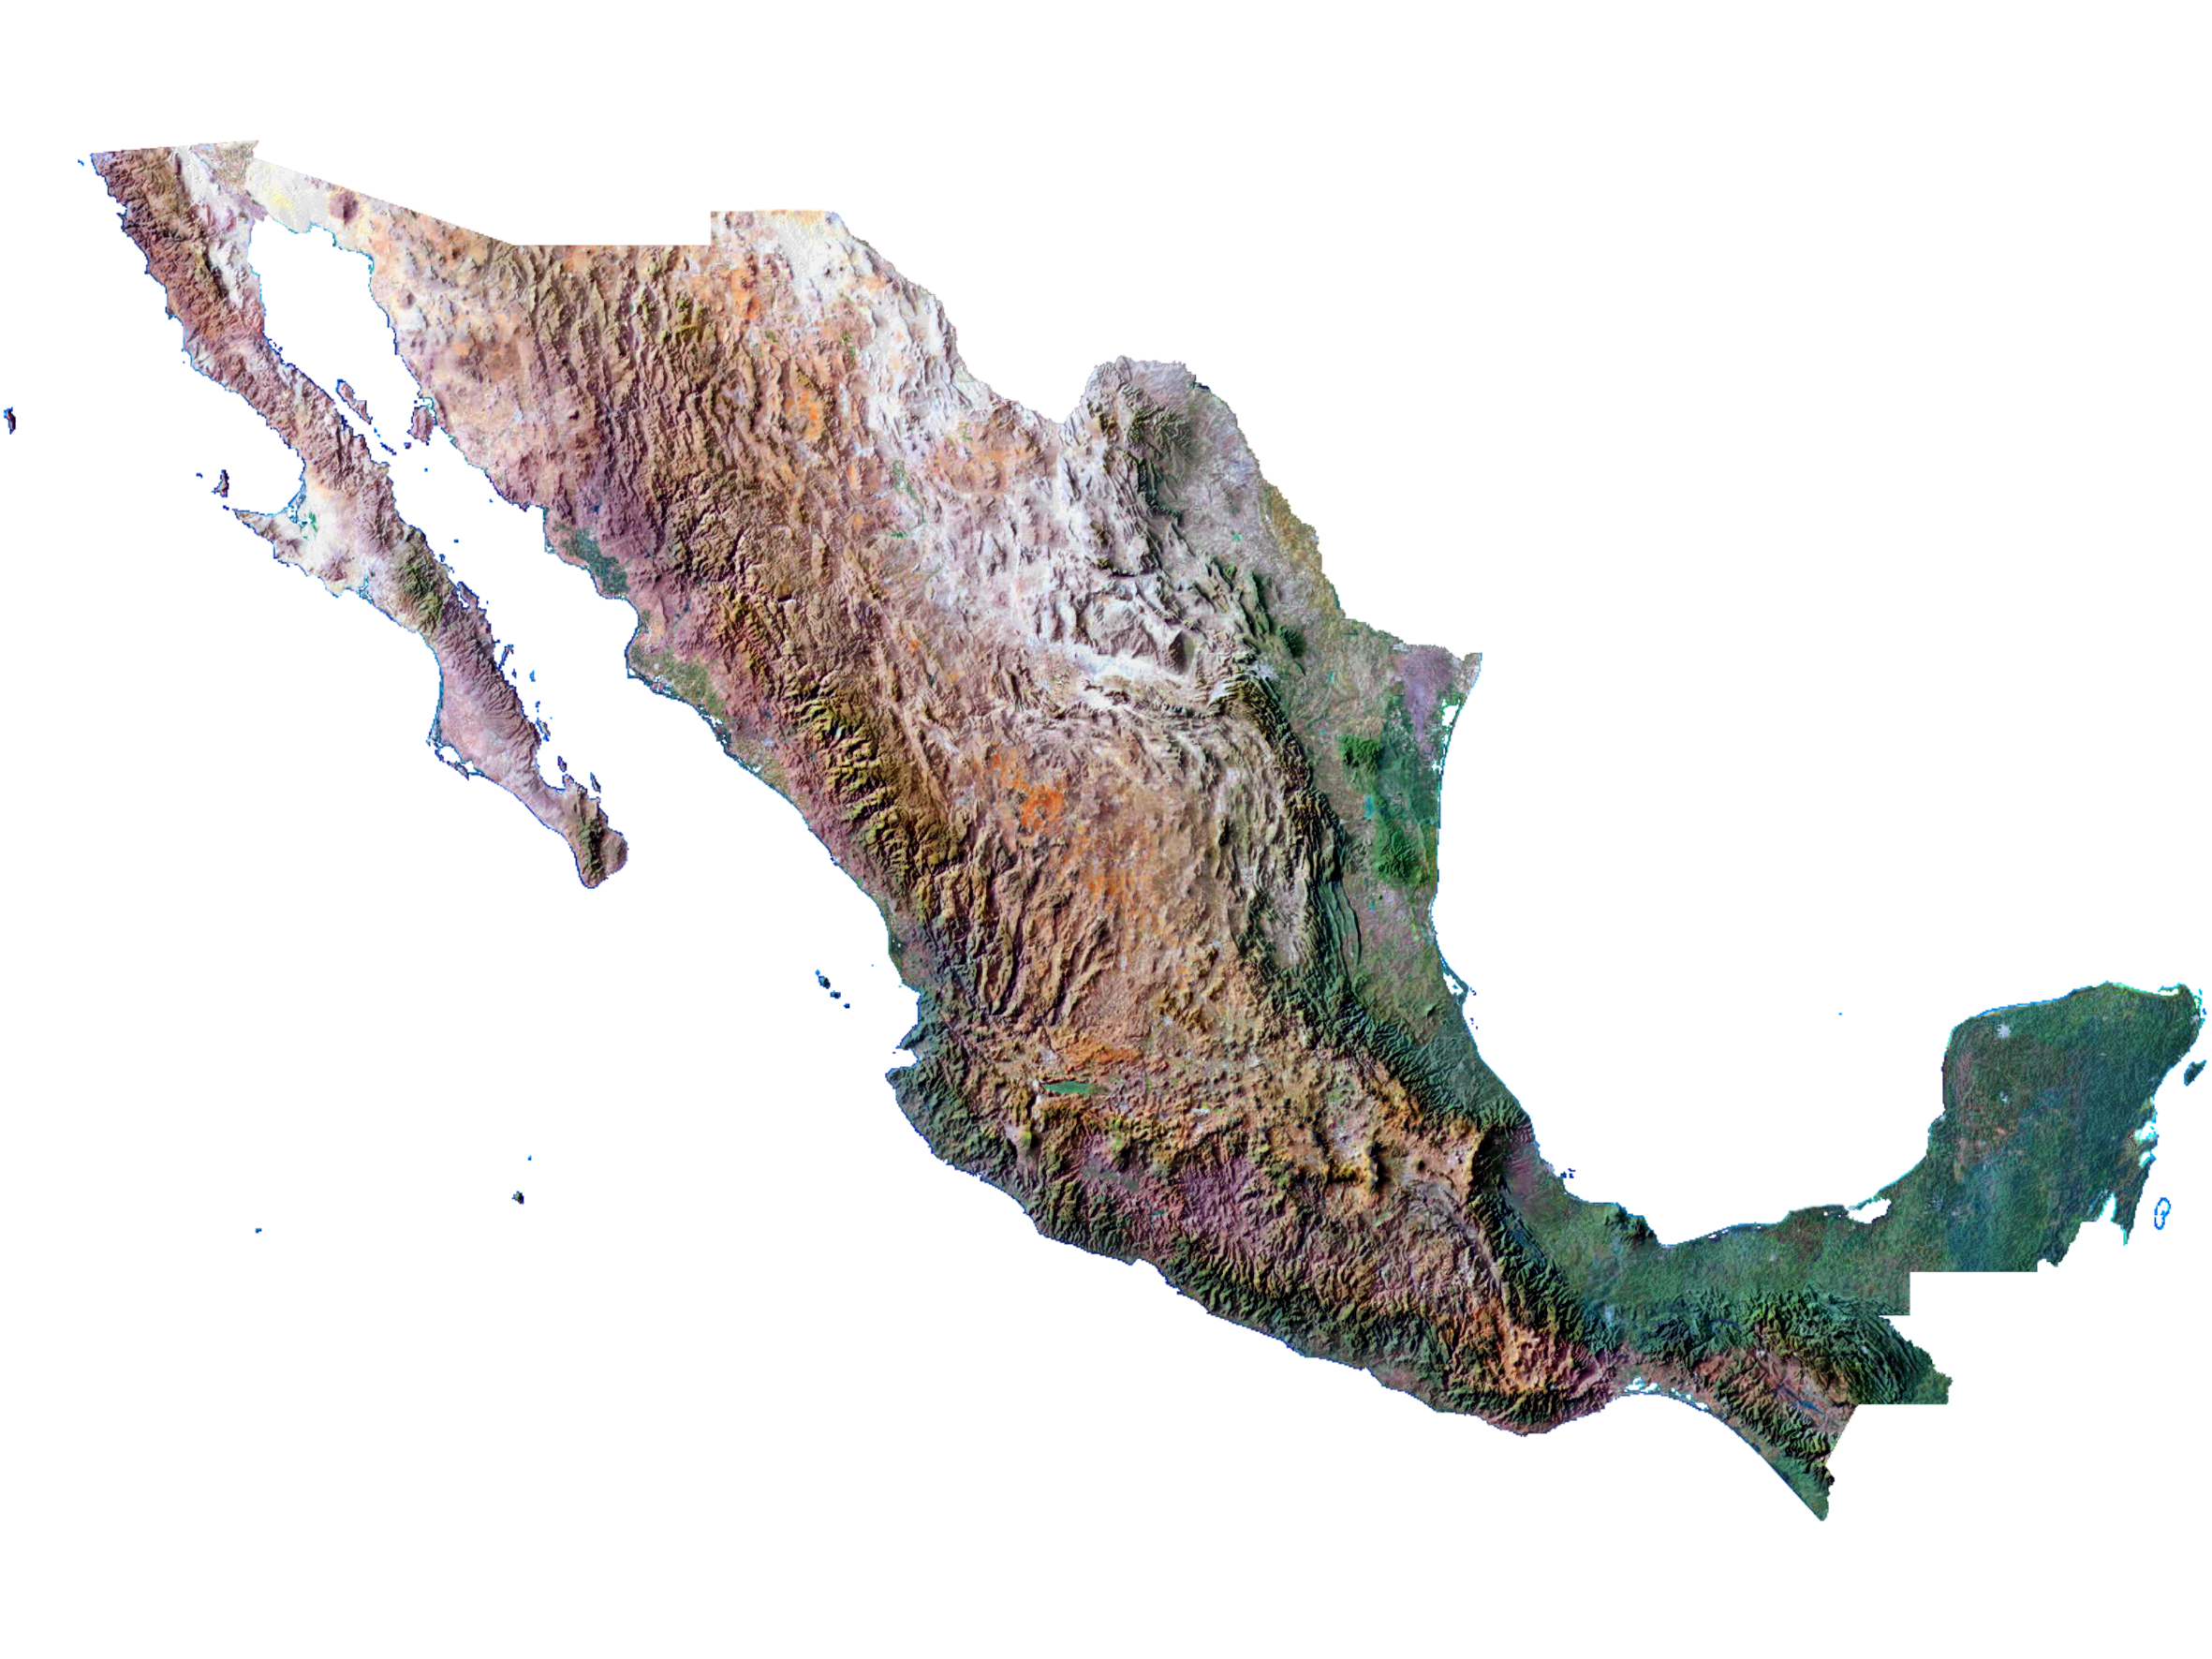
RGB hillshade of Mexico.
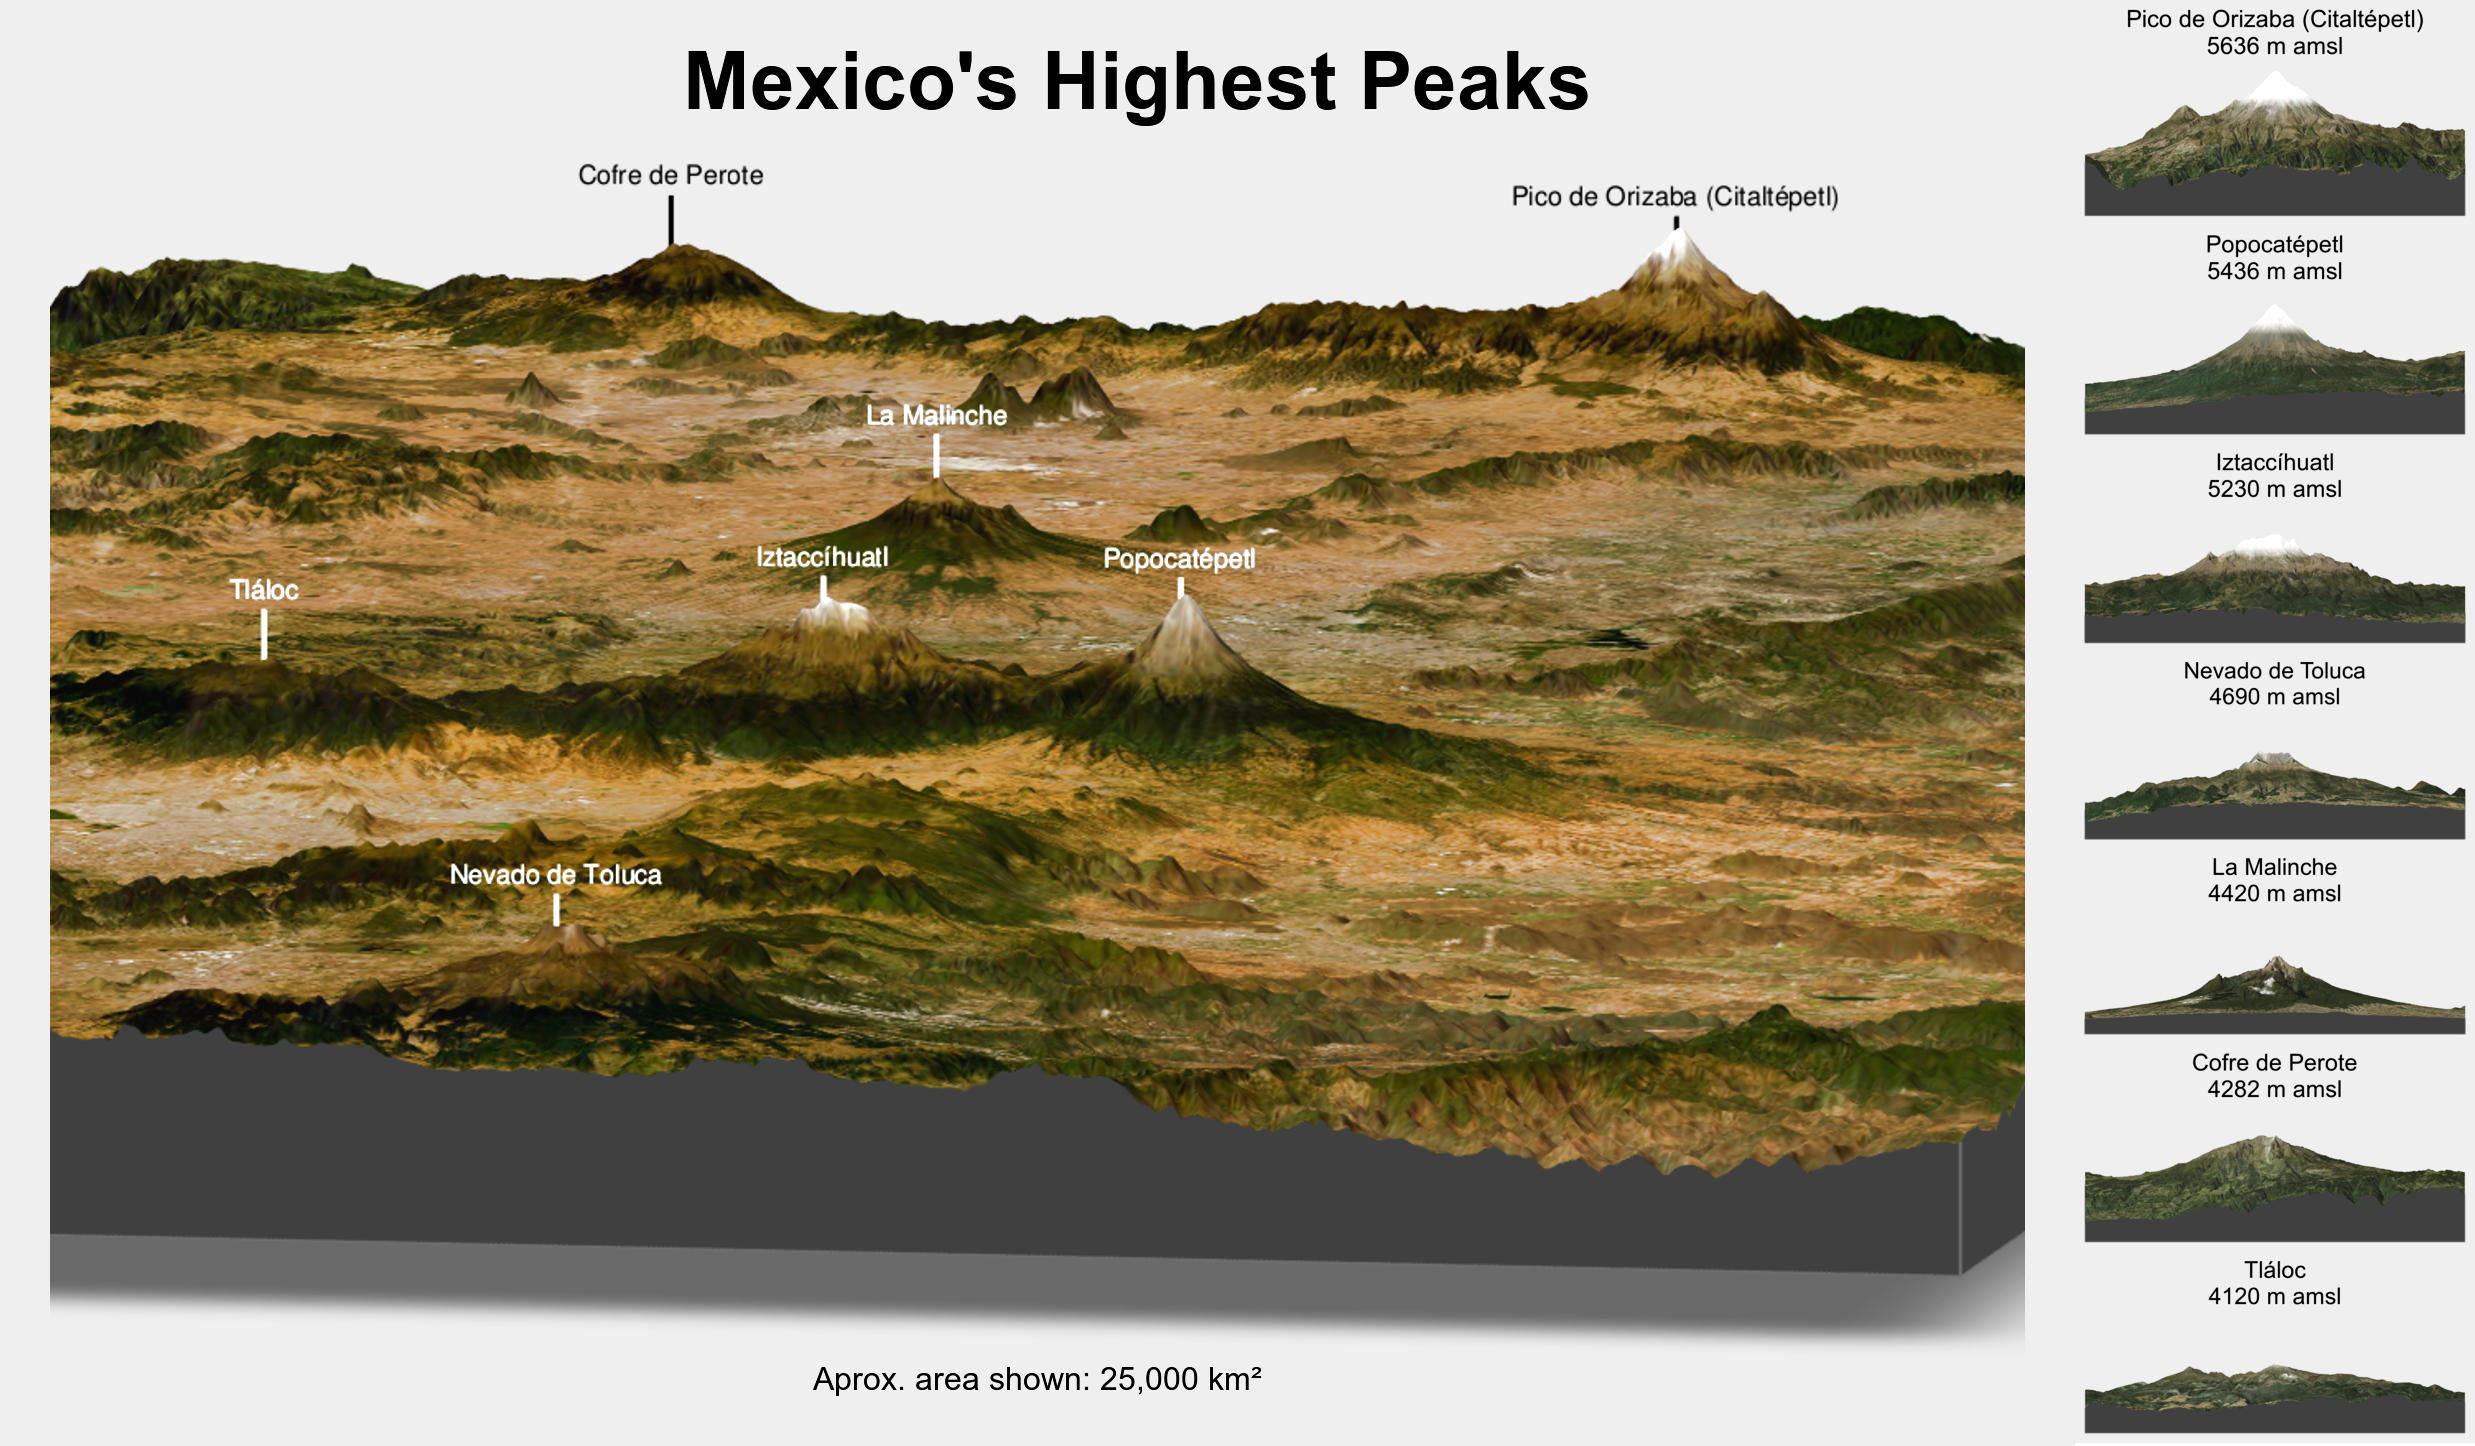
Mexico’s highest peaks - 3D plot (missing the Nevado de Colima).
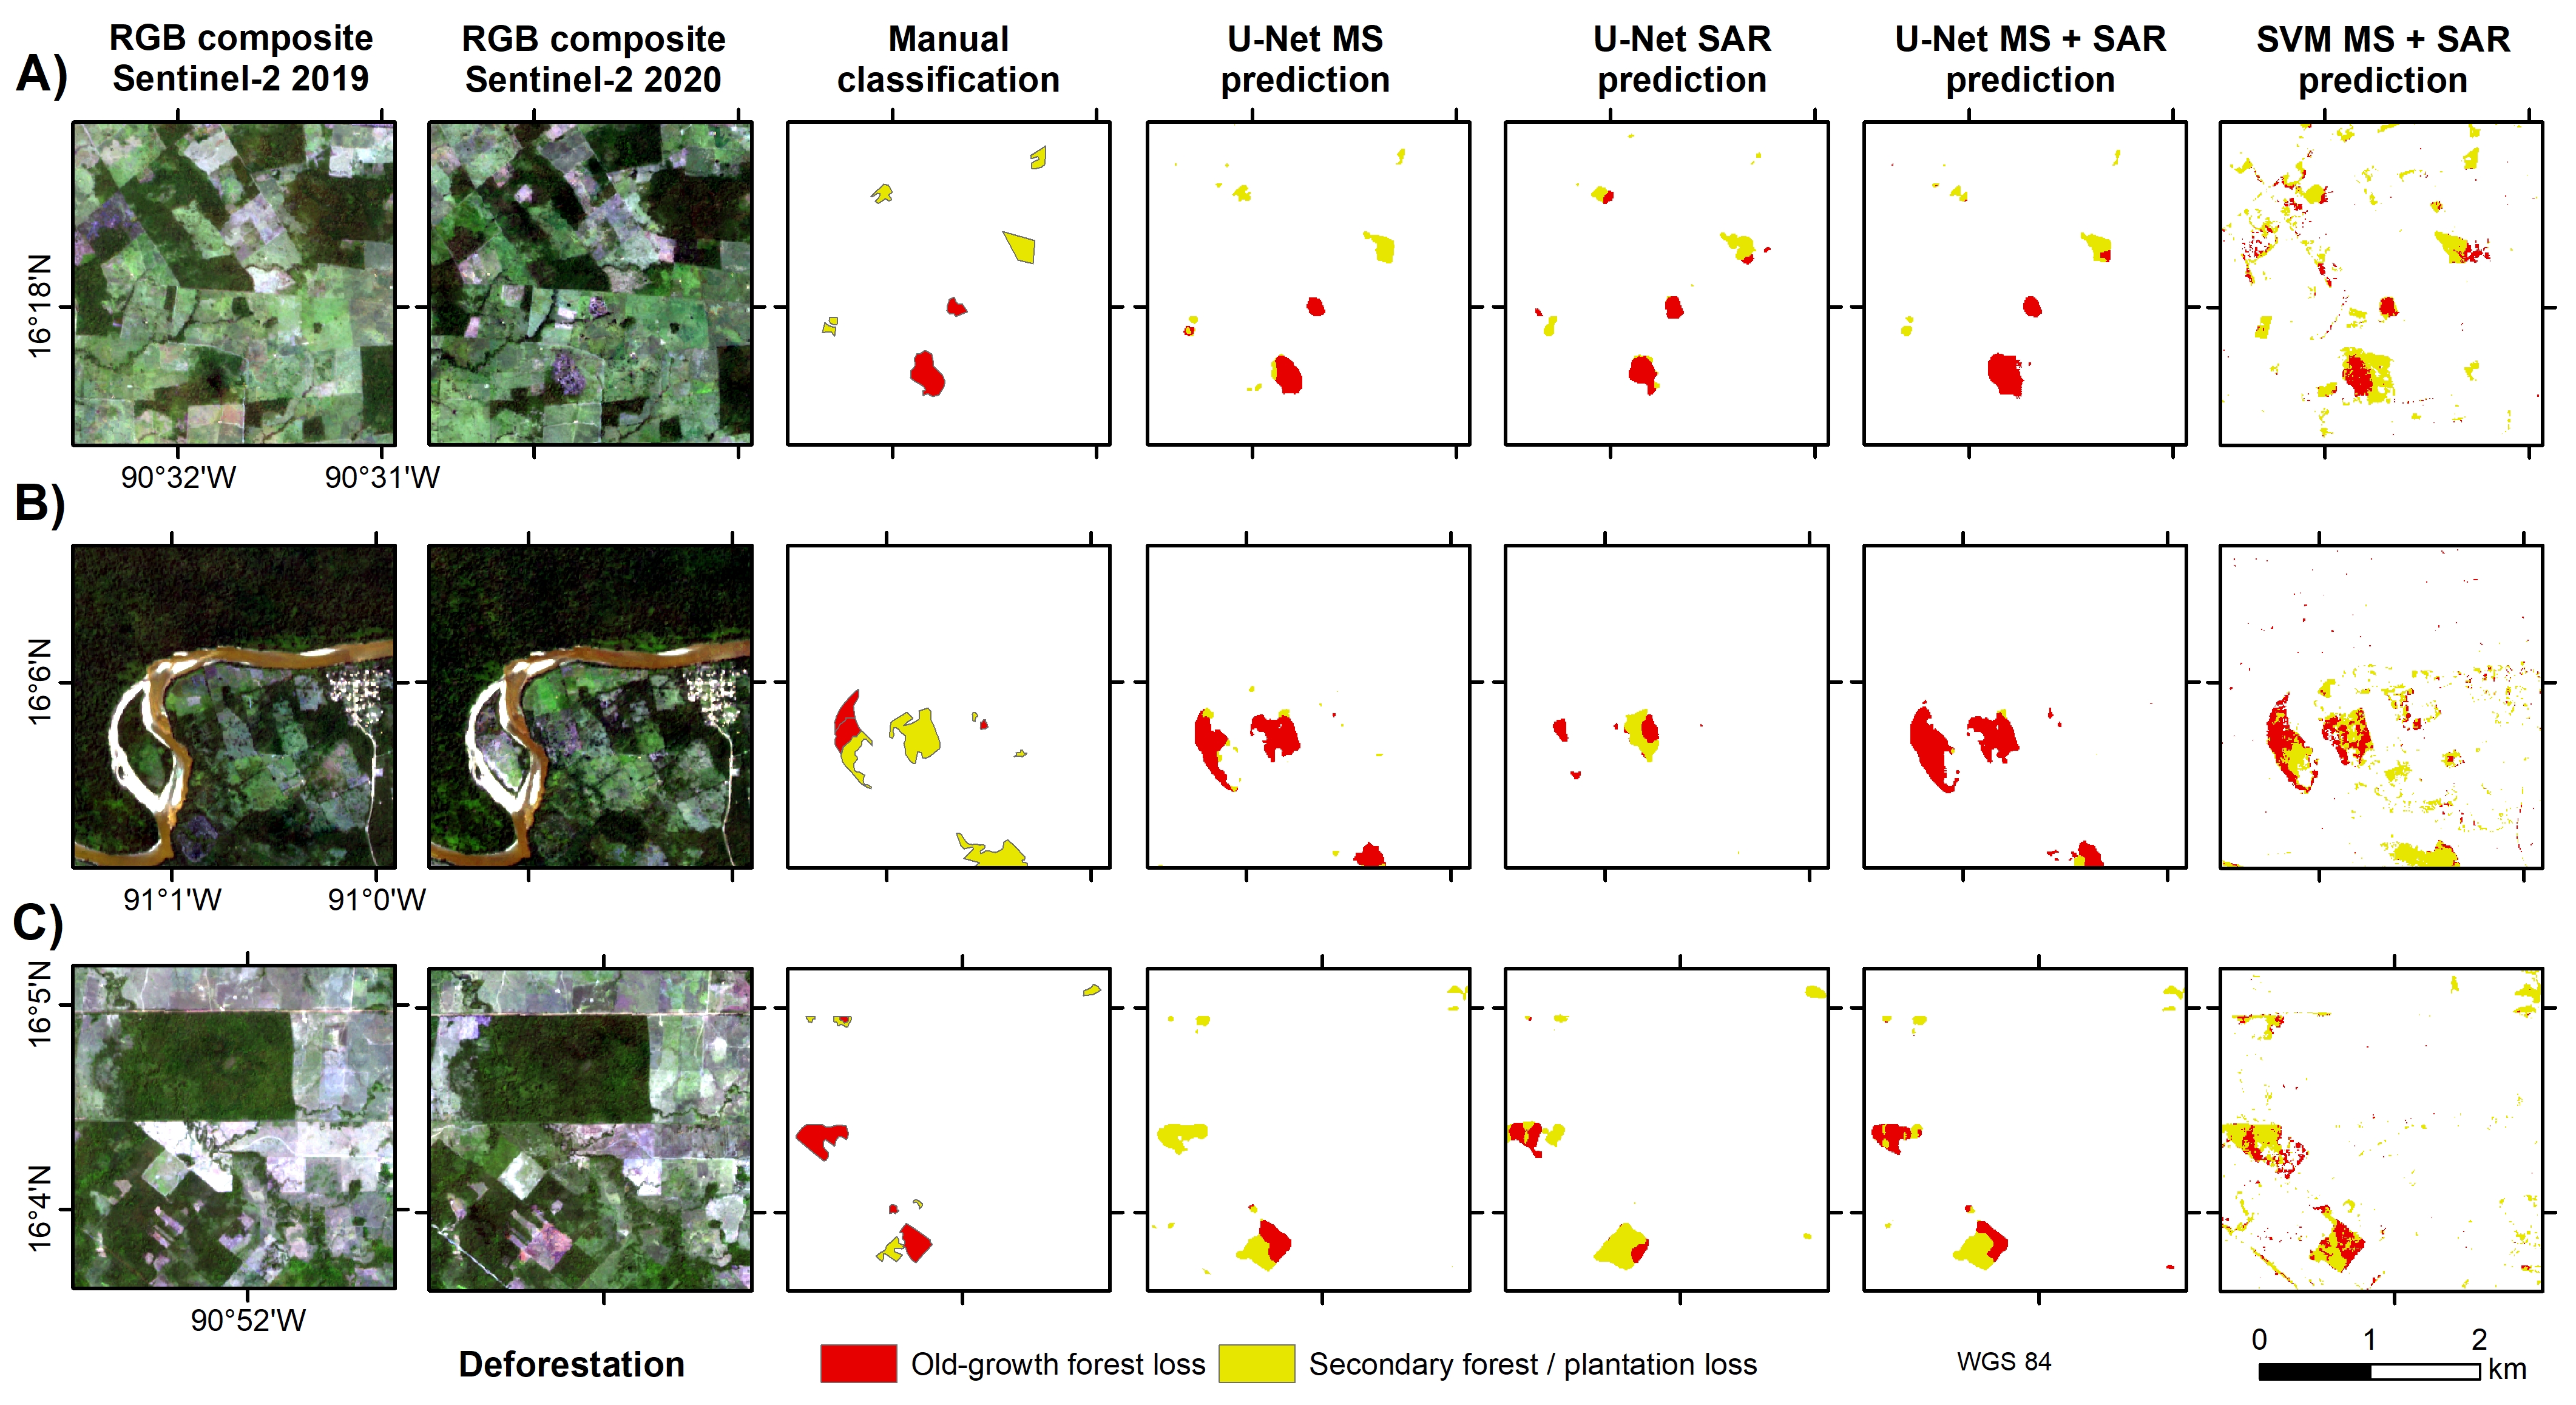
Comparison among different deforestation detection methods using U-Net and SVM with Sentinel-2 (MS) and -1 images (SAR)
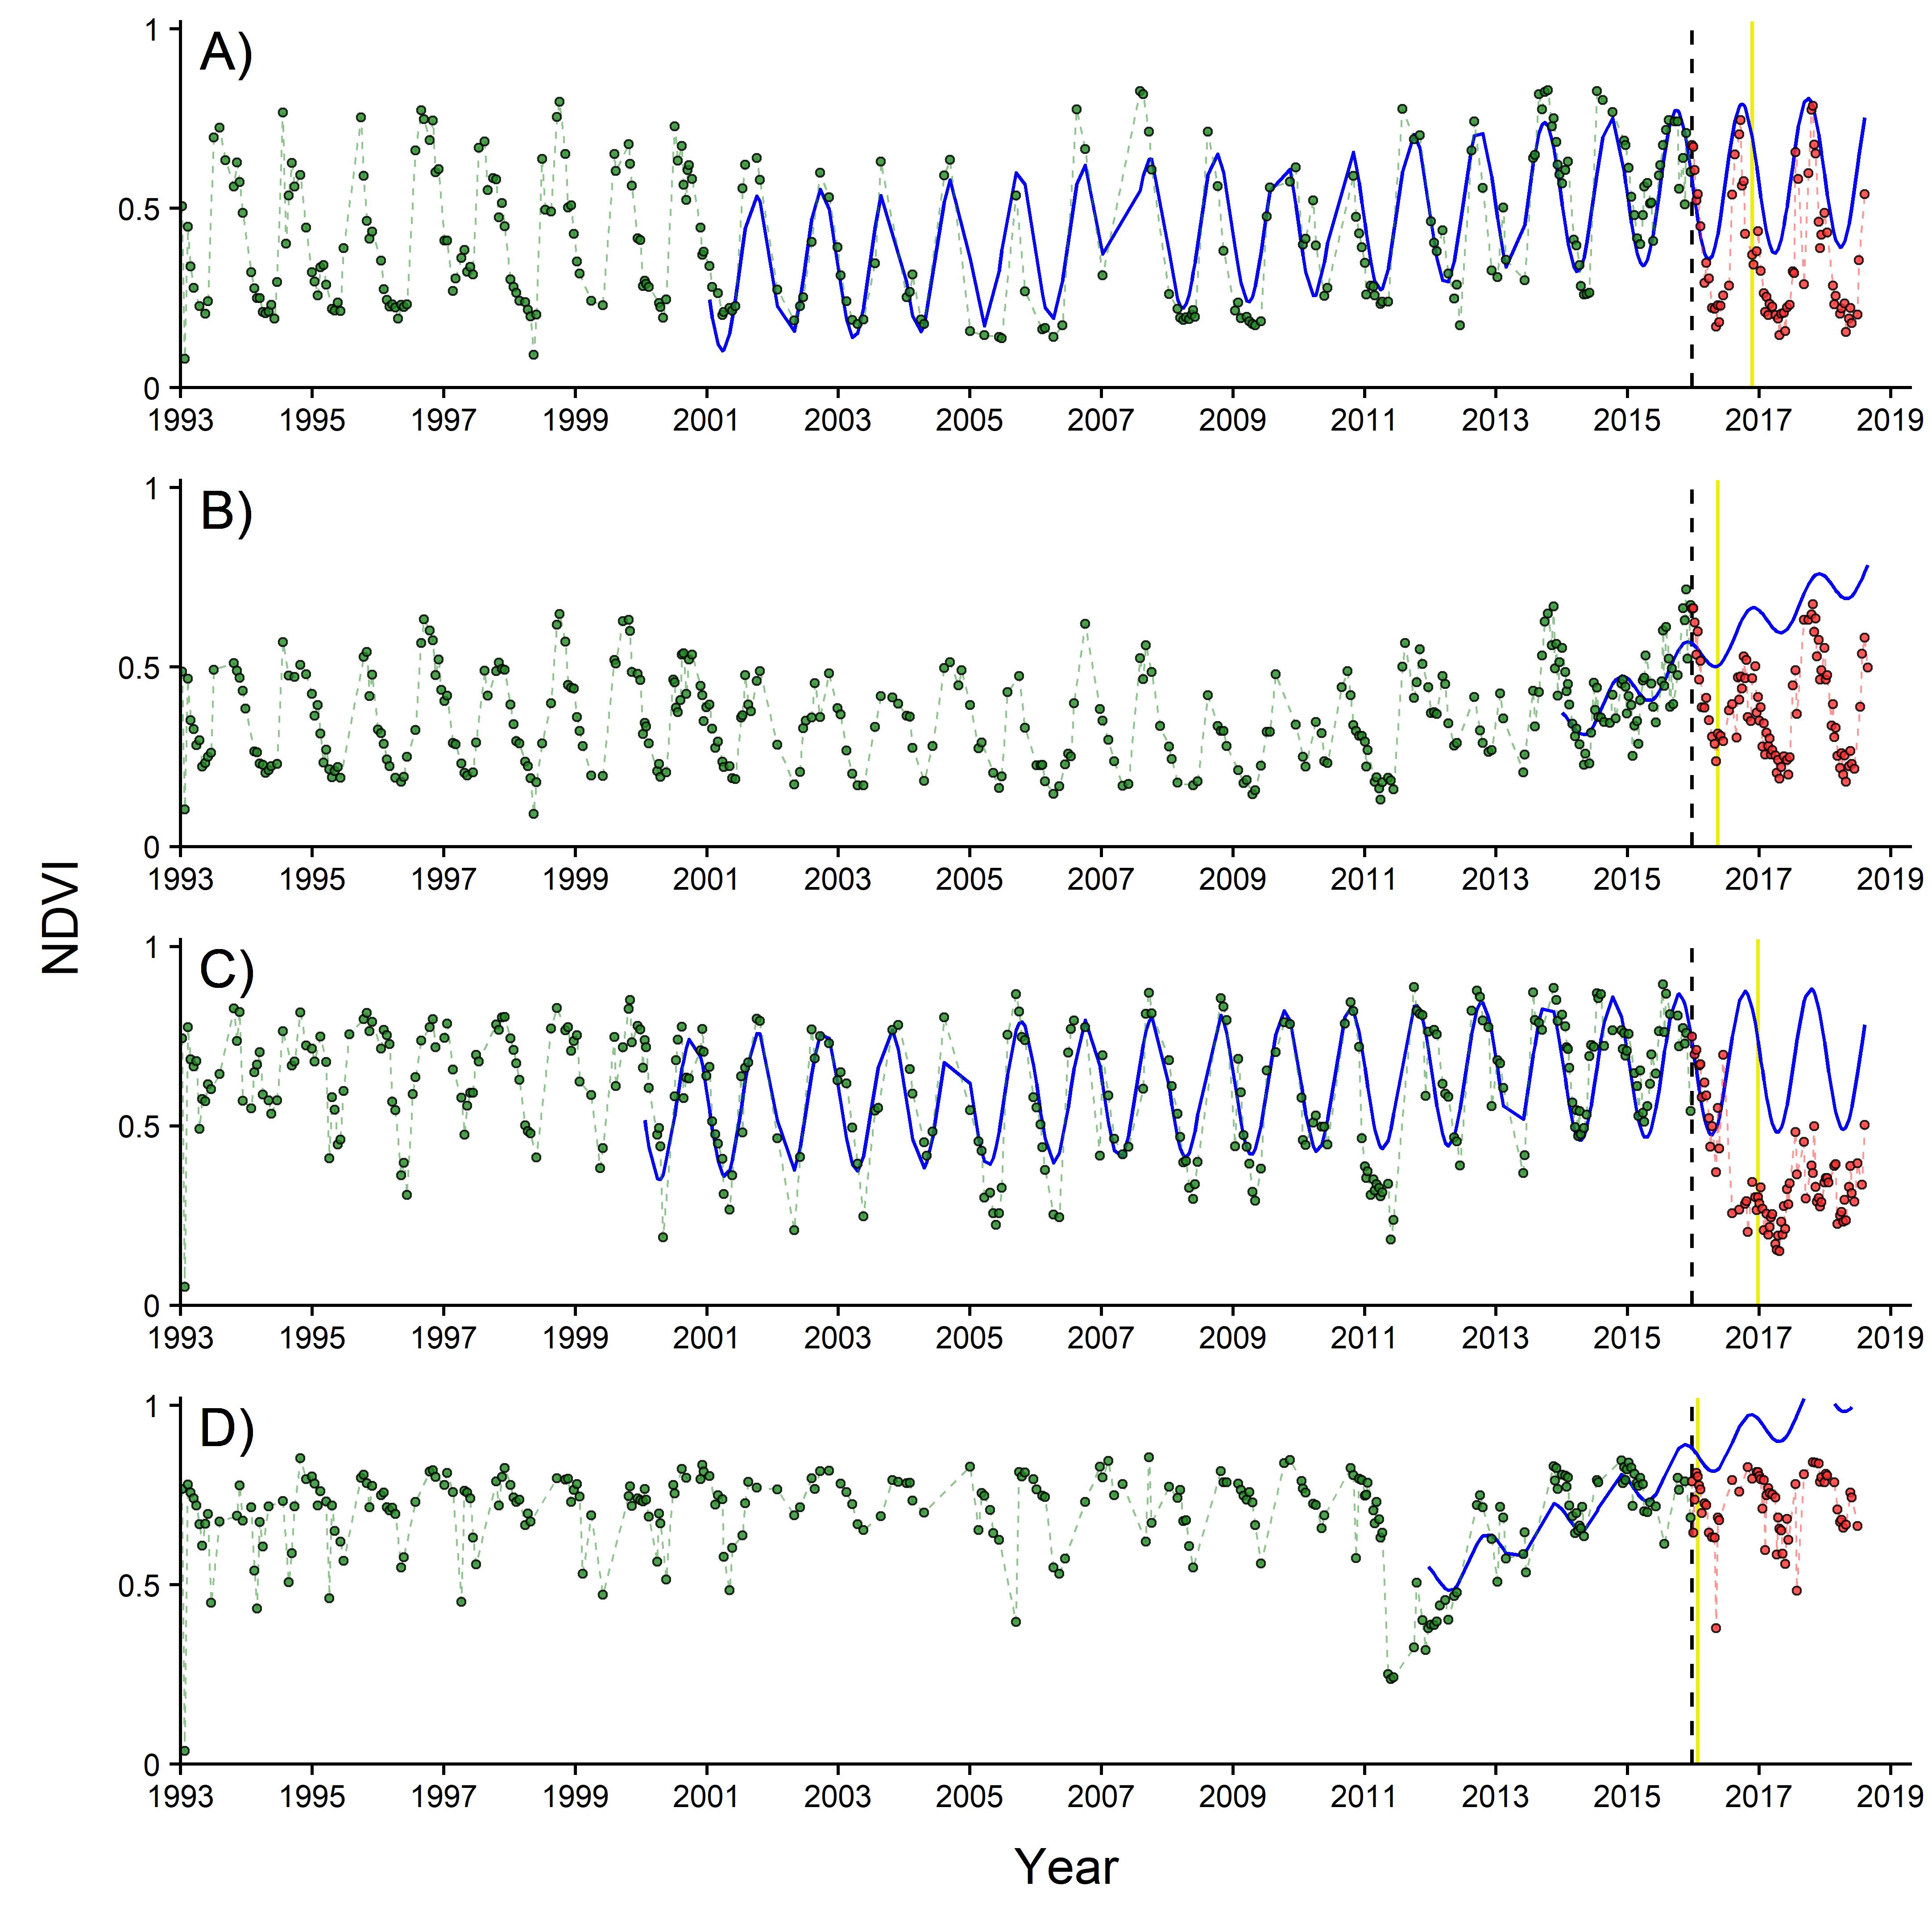
Example of four NDVI time series where changes were detected using BFAST
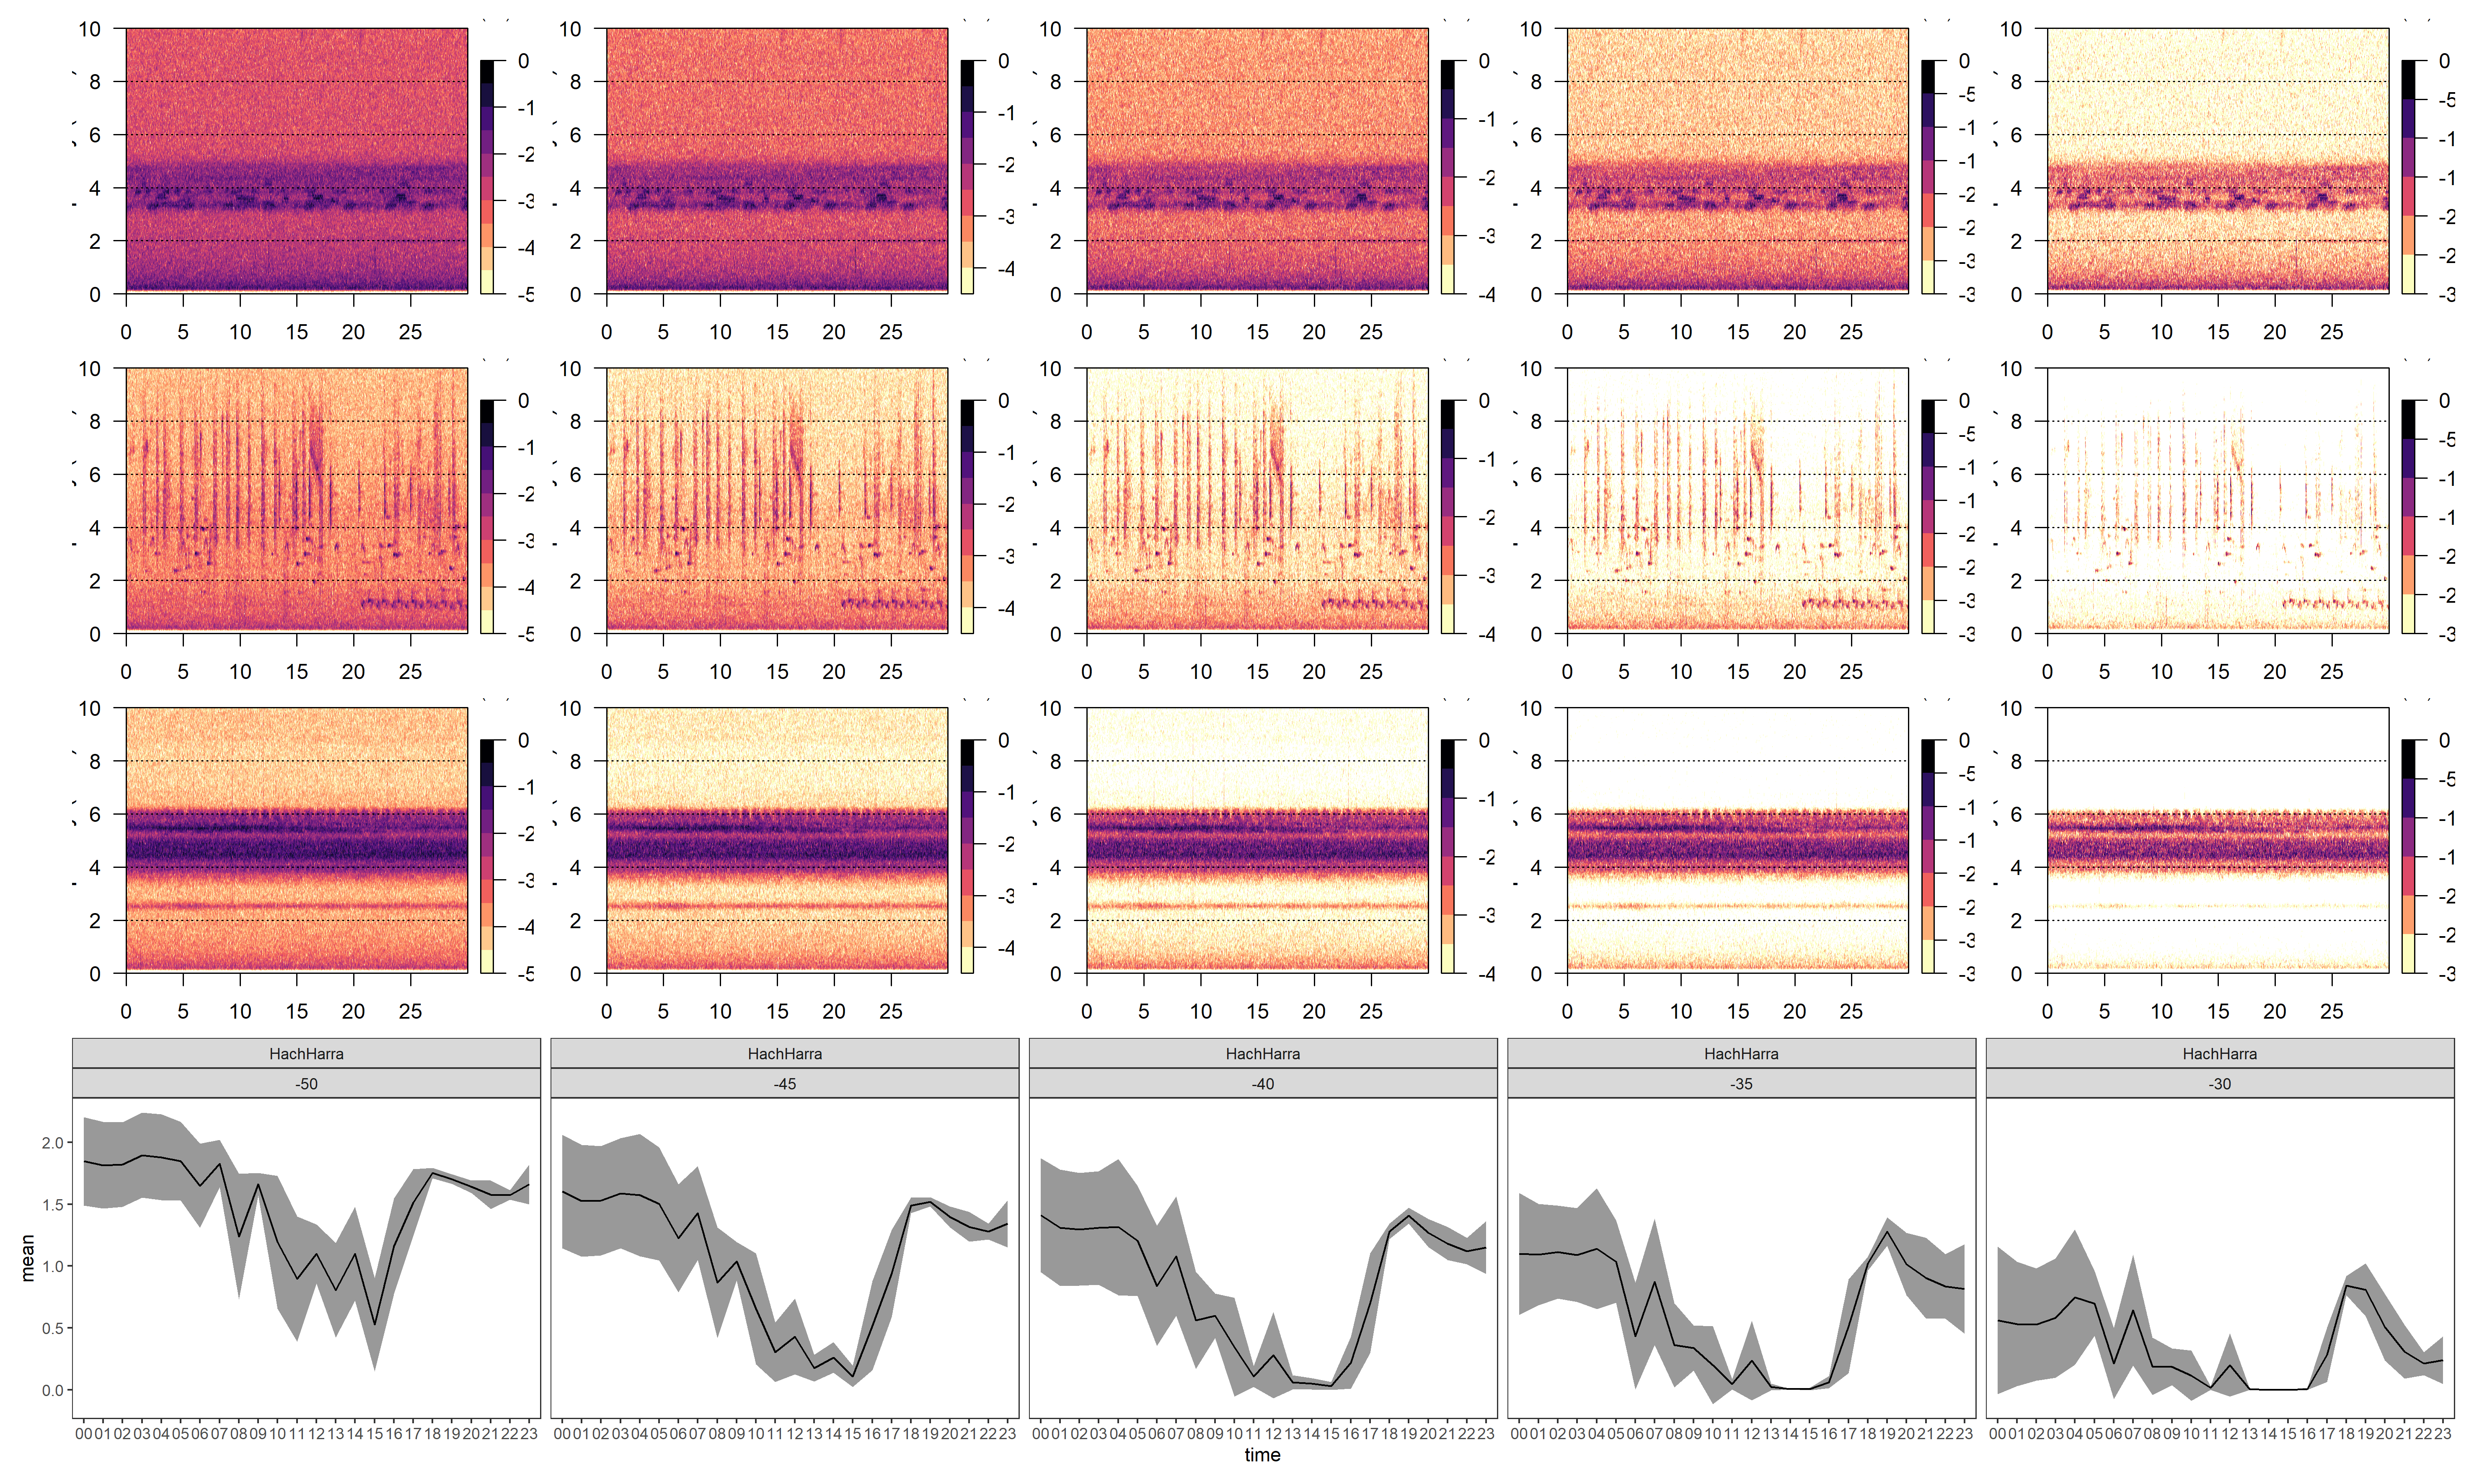
Spectrograms obtained using different thresholds (columns) for three different hours (rows) and its effect over a acoustic diversity index (final row)
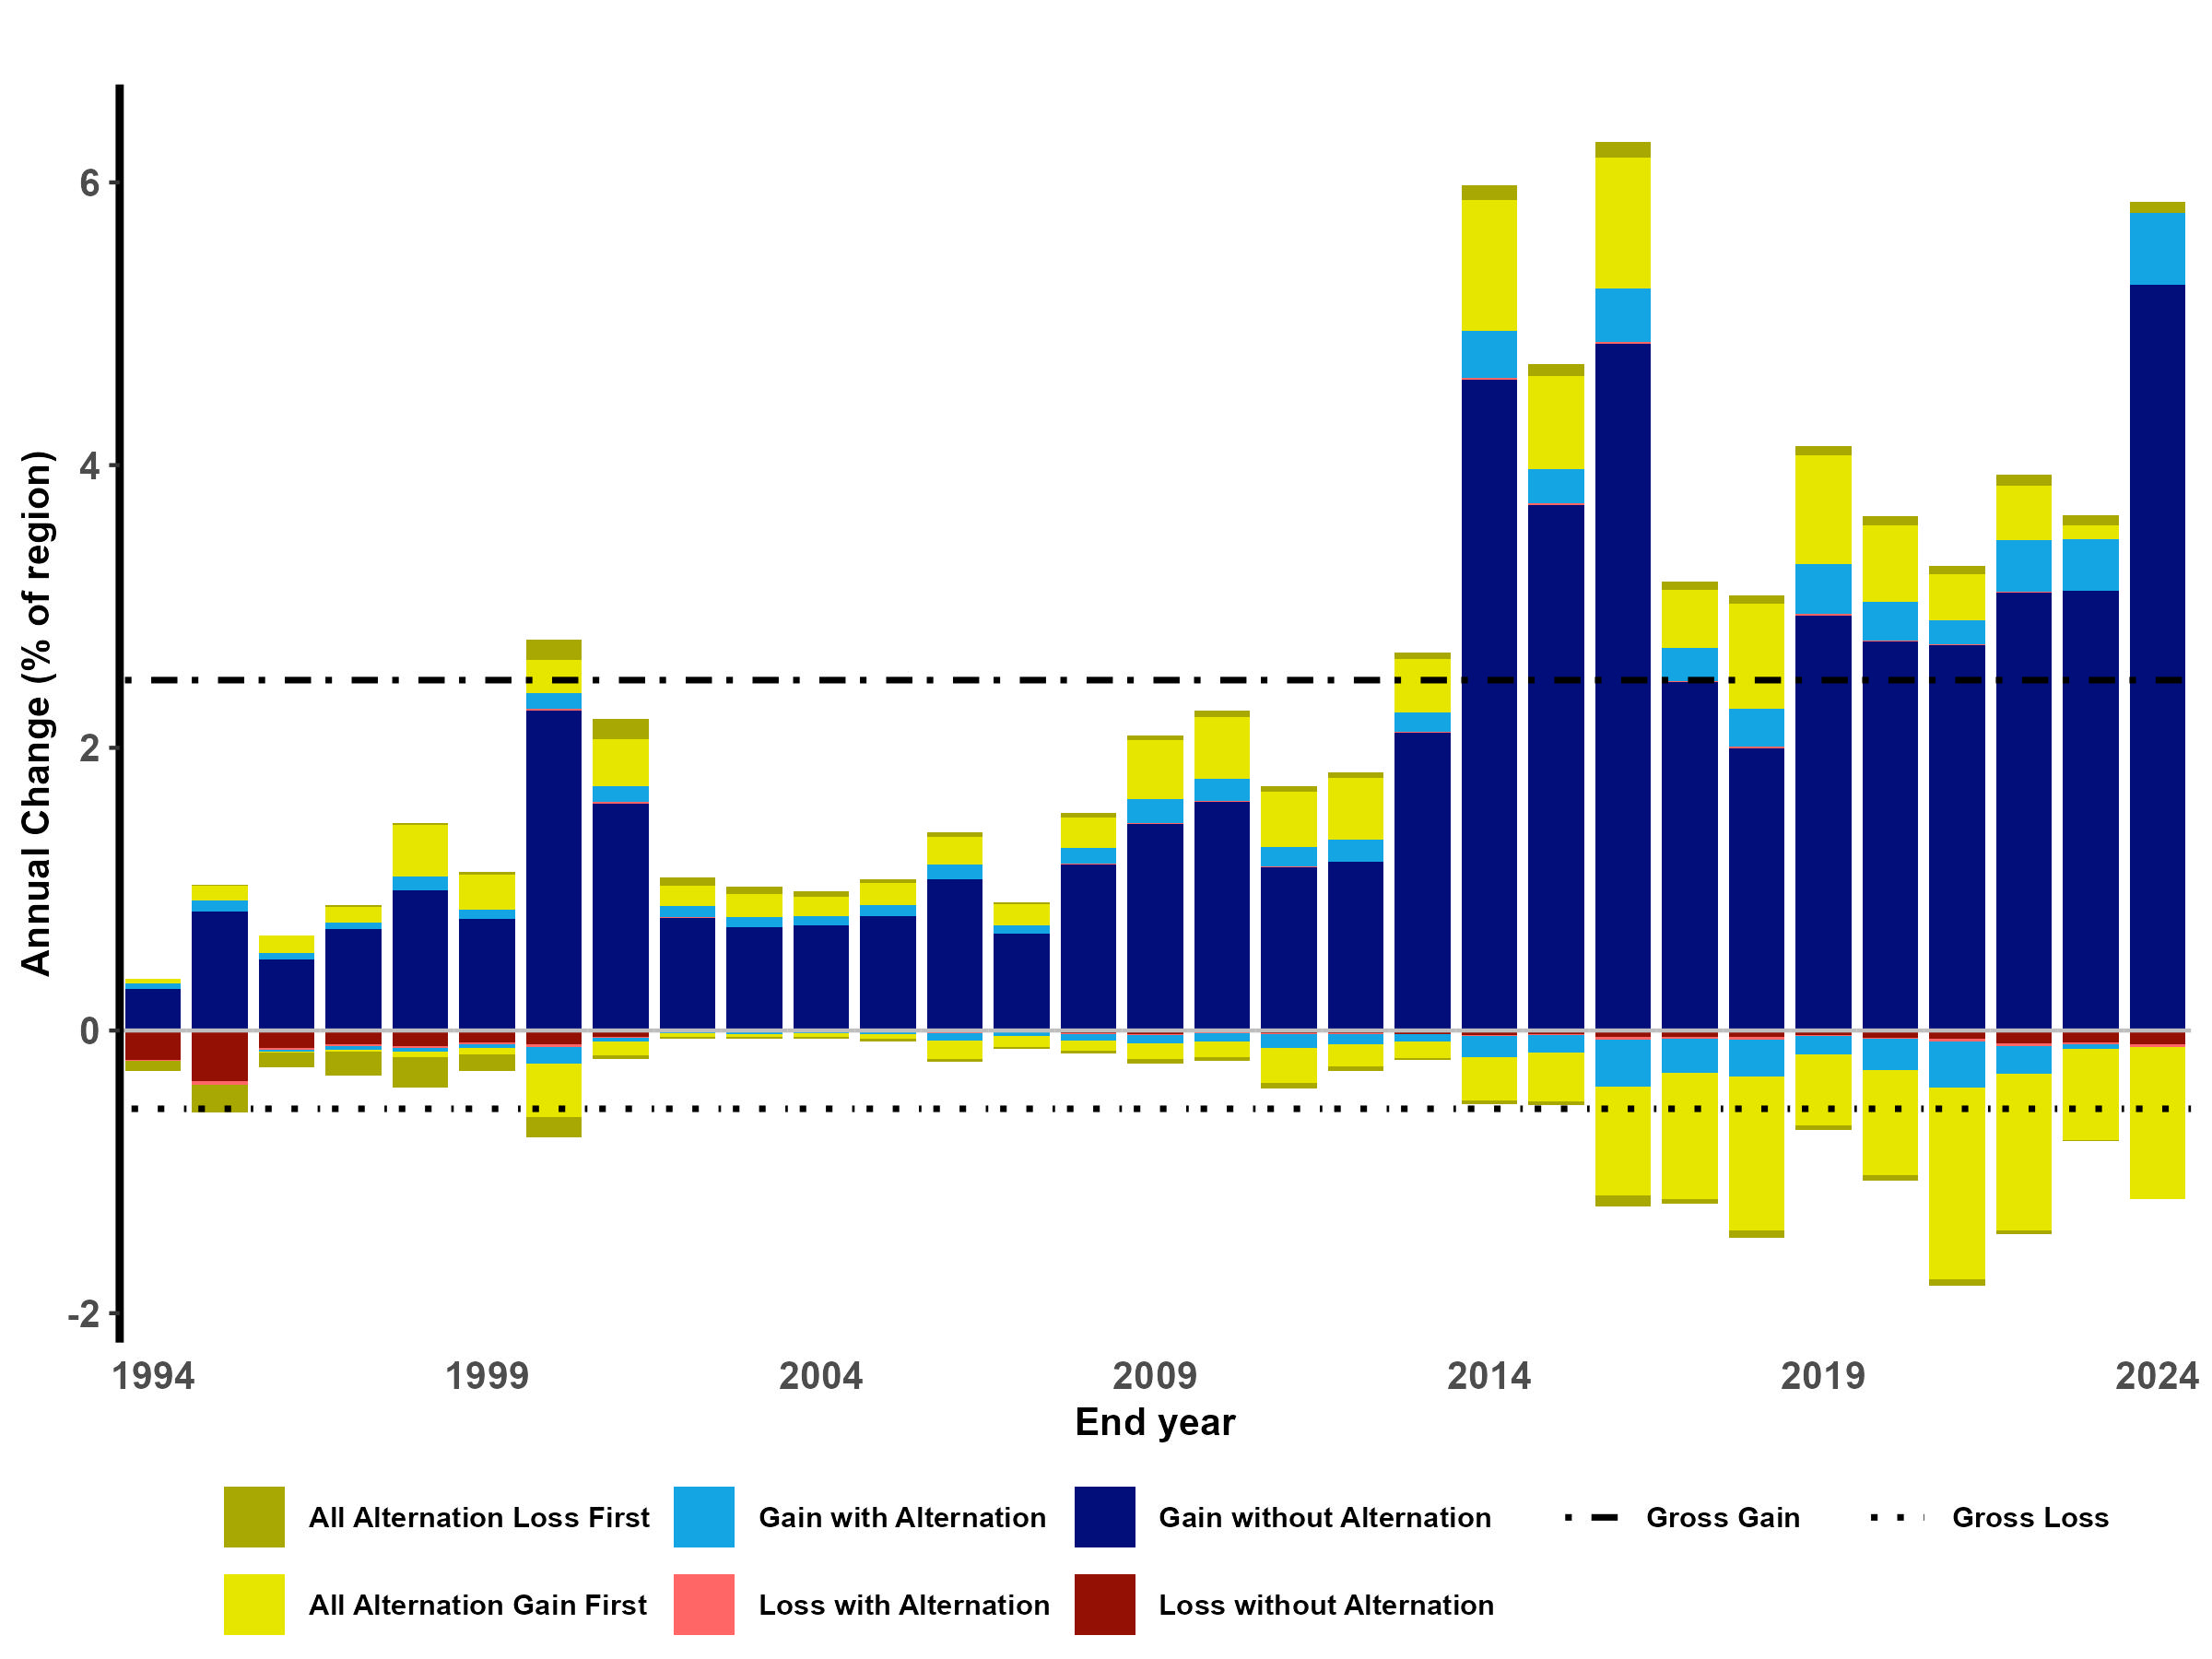
Trajectory analysis for land use land cover change associated with avocado orchards using CCDC and landsat images
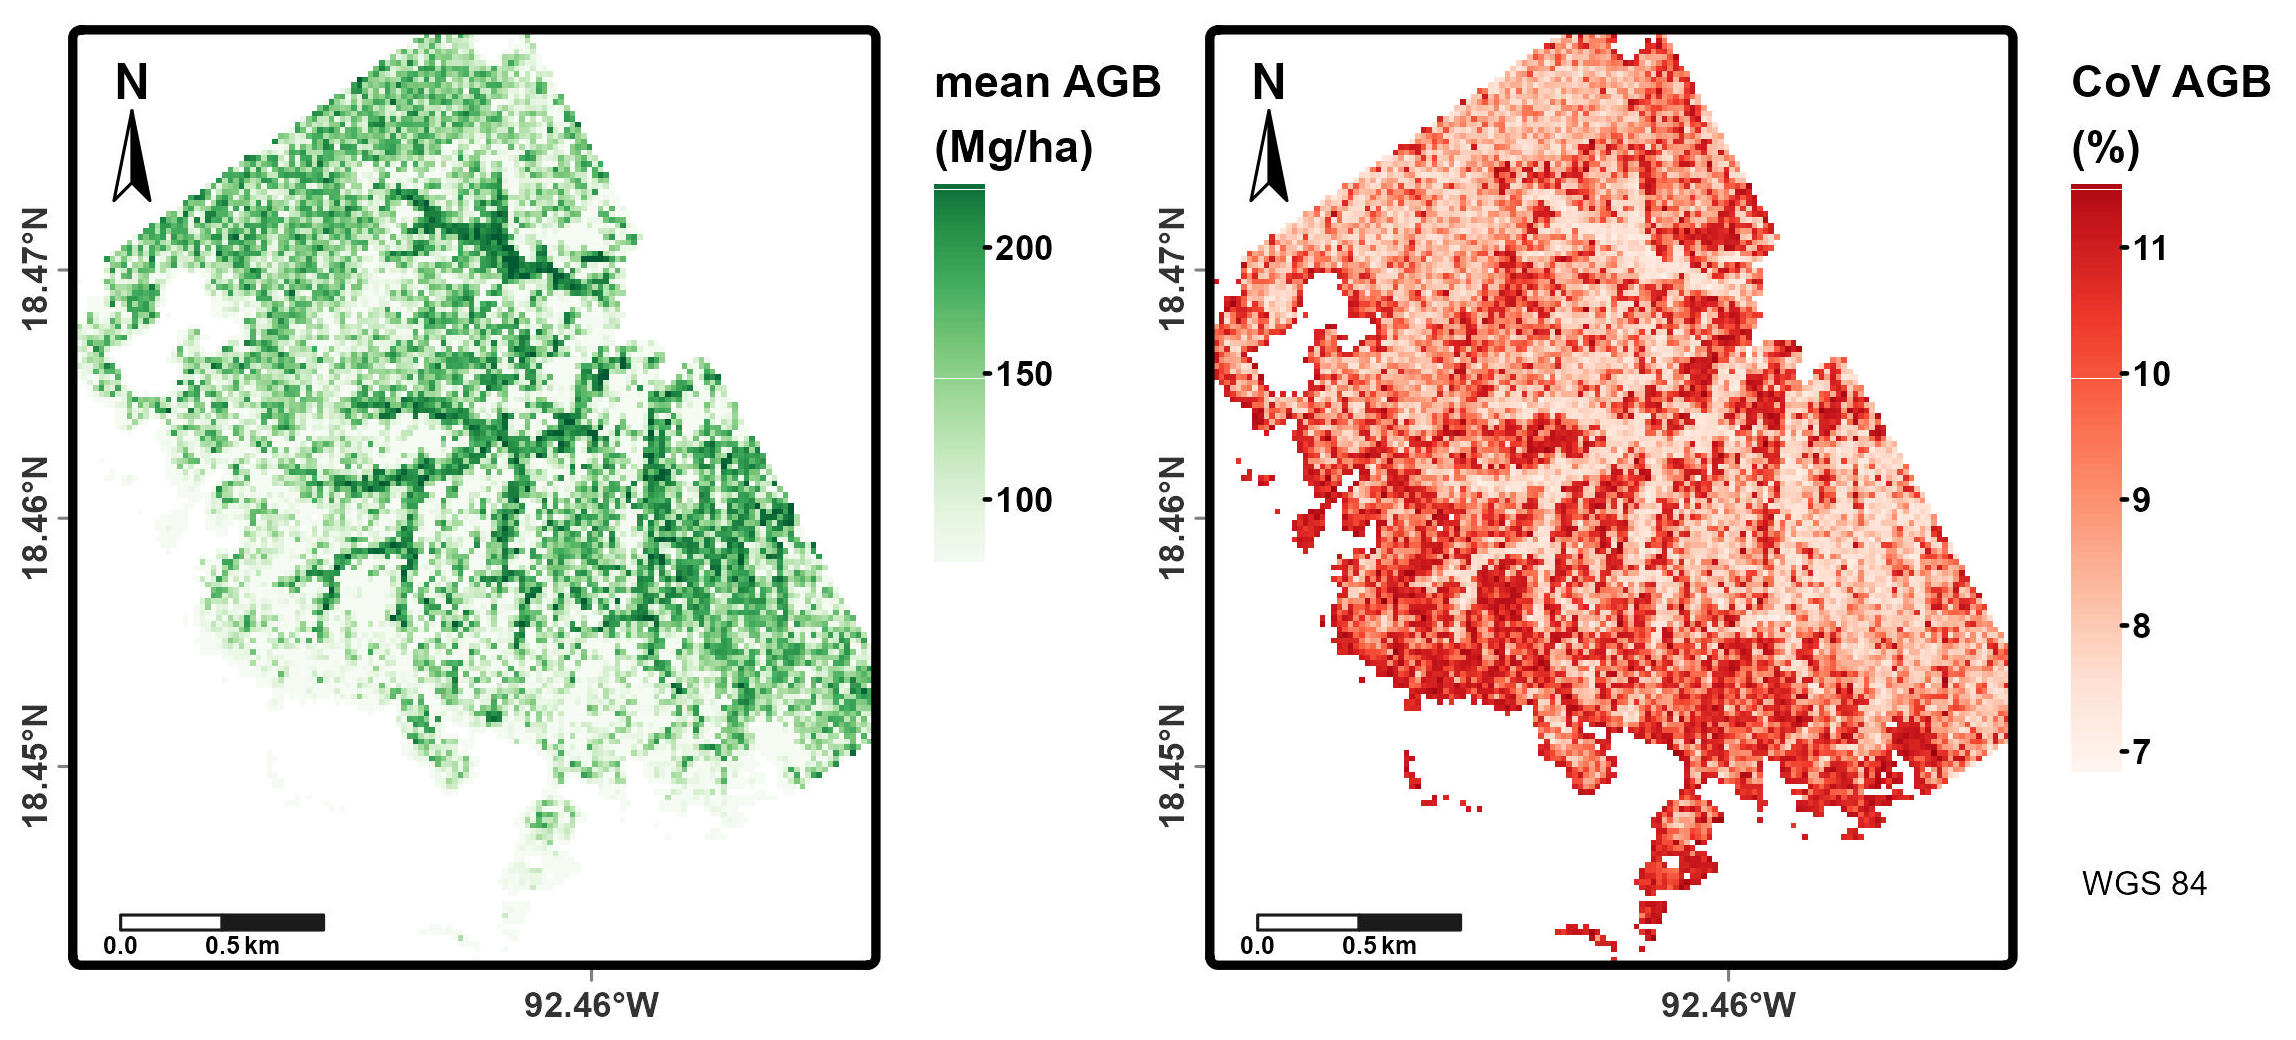
Aboveground biomass predictions and its variation based on LiDAR metrics (ALS) using a random forest algorithm.